
Fig. 3
- ID
- ZDB-FIG-221214-10
- Publication
- Engerer et al., 2021 - Notch-mediated re-specification of neuronal identity during central nervous system development
- Other Figures
- All Figure Page
- Back to All Figure Page
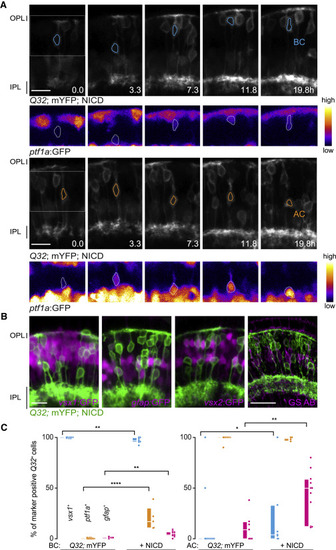
Figure 3. Marker expression in re-specified ACs (A) In Q32 NICD, BCs (outlined cyan, upper grayscale panels), express ptf1a:GFP (Fire LUT), albeit at lower levels than in ACs (outlined orange, lower grayscale panels). Ptf1a-GFP signal bleeds through Q32-YFP channel (grayscale panels). (B) Following NICD OE, transdifferentiated Q32 ACs do not express vsx1:GFP but gfap:GFP. Q32 ACs are negative for vsx2:GFP and glutamine synthetase (GS antibody, AB). (C) Percentage of Q32 BCs (left) and ACs (right) expressing vsx1, ptf1a and gfap in WT or Q32 NICD. Median and IQR represented. BCs: vsx1:GFP+: Q32 WT, (1227 BCs, 14 fish) versus NICD, (416 BCs, 7 fish); p = 0.0034. Ptf1a:GFP+: Q32 WT (1,614 BCs, 14 fish) versus NICD (486 BCs, 5 fish); p < 0.0001. Gfap:GFP+: Q32 WT (718 BCs, 7 fish) versus NICD (984 BCs, 11 fish); p = 0.0022. ACs: vsx1:GFP+: Q32 WT (28 ACs, 15 fish) versus Q32 NICD (100 ACs, 7 fish); p = 0.0129. Ptf1a:GFP+: Q32 WT (60 ACs, 13 fish) versus Q32 NICD (124 ACs, 4 fish); p = 0.1206. Gfap:GFP+: Q32 WT (43 ACs, 7 fish) versus Q32 NICD (335 ACs, 11 fish); p = 0.0078. Mann-Whitney U test for pairwise comparisons. Scale bars, 10 μm (A and B). |