
Fig. 3
- ID
- ZDB-FIG-221211-68
- Publication
- Ablain et al., 2022 - Loss of NECTIN1 triggers melanoma dissemination upon local IGF1 depletion
- Other Figures
- All Figure Page
- Back to All Figure Page
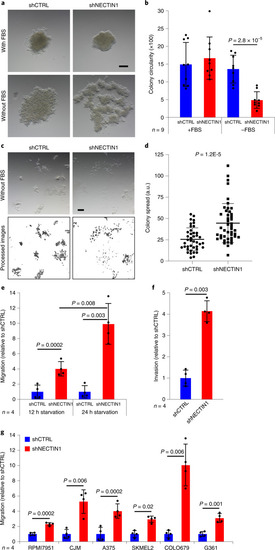
a, Images of the structures formed by 10,000 A375 human melanoma cells stably expressing a control shRNA (shCTRL) or an shRNA directed against NECTIN1 (shNECTIN1) after 8 days in low-attachment conditions in the presence or absence of serum (FBS). Scale bar, 200 μm. Data are representative of nine independent experiments. b, Circularity of the colonies formed by A375 human melanoma cells in low-attachment conditions as shown in panel a (Methods). Data are presented as mean ± s.d. of nine independent colonies per condition (paired two-tailed t-test). c, Images of the colonies formed by 1,000 of the cells described in panel a after 7 days in collagen-rich matrix in the absence of serum (FBS) (top). Scale bar, 50 μm. Data are representative of three independent experiments. Analysis of the images shown on top using ImageJ (bottom). d, Spread of the colonies formed by A375 human melanoma cells in collagen-rich matrix as shown in panel c (Methods). Data are presented as mean ± s.d. (n = 41 (shCTRL) and n = 45 (shNECTIN1)) of three independent experiments (two-tailed t-test). a.u., arbitrary units. e, Migration of A375 human melanoma cells stably expressing an shRNA directed against NECTIN1 (shNECTIN1) relative to cells expressing a control shRNA (shCTRL) in a transwell assay after 12 or 24 h of serum starvation. Data are presented as mean ± s.d. of four independent experiments. Cells were allowed to migrate for 6 h (paired two-tailed t-test). f, Invasion through Matrigel of A375 human melanoma cells after 12 h of serum starvation as described in panel e. Cells were allowed to migrate for 10 h. Data are presented as mean ± s.d. of four independent experiments (paired two-tailed t-test). g, Migration of six human melanoma cell lines after 12 h of serum starvation as described in panel e. Cells were allowed to migrate for different times depending on the cell line (Extended Data Fig. 4i and Methods). Data are presented as mean ± s.d. of four independent experiments (paired two-tailed t-test). |