
Figure 6.
- ID
- ZDB-FIG-221211-314
- Publication
- Nelson et al., 2022 - The developmental progression of eight opsin spectral signals recorded from the zebrafish retinal cone layer is altered by the timing and cell type expression of thyroxin receptor β2 (trβ2) gain-of-function transgenes
- Other Figures
- All Figure Page
- Back to All Figure Page
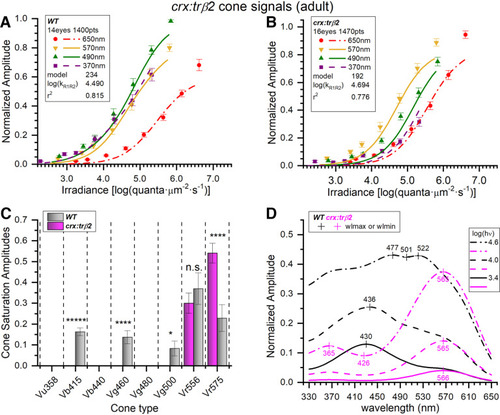
Adult crx:mYFP-2A-trβ2 transgenics are red-cone dichromats. A, Wild-type cone-PIII irradiance-response curves and datapoints at four stimulus wavelengths. The 370-, 490-, 570-, and 650-nm amplitudes are means (±SE) from the cumulative dataset (n = 20 except at 650 nm where n = 20 or 40). Curves are generated from the optimal model (#234) fit to a cumulative 1400 responses at seven irradiances for each of nine wavelengths as compiled from 20 spectral datasets acquired in 14 WT adult eyecups. B, The crx:trβ2 gain-of-function transgene causes irradiance-response points and model curves to bunch together as compared with WT. The model generating the curves (#192) is fit to 1470 cumulative responses compiled from 21 datasets acquired from 16 crx:trβ2 eyecups. The amplitudes (±SE) are means (370, 490, 570, and 650 nm, n = 21 except for 650 nm, n = 21 or 42). C, Signals from five blue, green, or red cone types were detected in WT adults (gray bars), but signals from only the two red-cone types were detected in crx:trβ2 eyecups (magenta bars). Fit values of cone saturation amplitudes (Vmi, Eq. 1; Fig. 2A) are plotted on a dataset-normalized scale (±SE). Except for Vr556 (LWS2) cone types differed significantly in amplitudes between WT and crx:trβ2 (asterisks, GraphPad Prism convention, n.s., not significant). Vb415 (B1, one-sample test): t(1373) = 8.77, p = 5.4 × 10⁻¹⁸; Vg460 (G1, one-sample test): t(1373) = 4.36, p = 1.4 × 10⁻⁵; Vg500 (G3, one-sample test): t(1373) = 2.30, p = 0.021; Vr556(R2): t(2818) = 0.782, p = 0.434; Vr575 (R1): t(2818) = 3.91, p = 9.2 × 10⁻⁵. D, Model spectral curves for adult WT (black) and crx:trβ2 (magenta) eyecups. The crx:trβ2 transgene shifts sensitivity peaks to long wavelengths at all stimulus irradiances. Curves are modeled for constant quantal stimuli at 3.4, 4.0, and 4.6 log(quanta·μm−2·s−1). A, B, The log(kR1R2) values are the irradiance semi-saturation values in log(quanta·μm−2·s−1) for both R1 and R2 cones. A–D, Eight- to 18-month adults, 10 mm aspartate medium. |