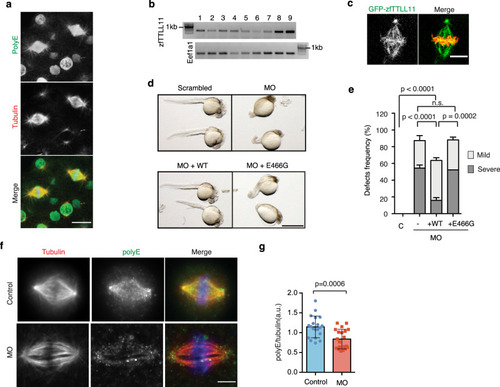
a Immunofluorescence image of a zebrafish embryo (at 4 h post fertilization [hpf]), showing PolyE (green), tubulin (red). Scale bar, 20 μm. Representative image of N = 3 independent experiments. b Semiquantitative RT-PCR showing zfTTLL11 expression in zebrafish embryos. Lanes 1, 4-cell stage; 2, 8-cell stage; 3, 64- cell stage; 4, 256-cell stage; 5, sphere; 6, shield; 7, 70% epiboly; 8, 90% epiboly; and 9, 24 hpf. Eef1a1 was amplified as a control. Representative blot of N = 4 independent experiments. c Fluorescent image of a spindle in a zebrafish embryo expressing GFP-zfTTLL11 (green) and H2B-mCherry (red). Scale bar, 10 μm. Representative image of N = 3 independent experiments. d Zebrafish embryos (36 hpf) injected at the zygote stage with scrambled MO (control), zfTTLL11-Morpholinos (MO), MO and zfTTLL11 mRNA (WT) or MO and catalytically inactive zfTTLL11 (MO + E466G) mRNA. Scale bar, 1 mm. e Cumulative bar plot of developmental defects (severe or mild) in 36-hpf embryos of N = 5 independent experiments, representative of a total of four independent experiments (≥20 embryos scored per condition). ***P < 0.001; ****P < 0.0001; P values are based on a two-tailed χ2 test with a 95% confidence interval. Error bars represent SD. f Immunofluorescence images of metaphase spindles from dissected cells from control and MO zebrafish embryos, showing PolyE (green), tubulin (red), and DNA (blue). Scale bar, 5 μm. g Graph showing the quantification of the polyE signal normalized to the total tubulin signal in control and siTTLL11 spindles. n (control) = 28 cells and n (siTTLL11) = 26 cells. Graph representative of N = 2 independent experiments. Error bars represent SD. The P value is based on unpaired two-sided t test with 95% confidence. Source data are provided as a Source Data file.
|
