
FIGURE 2
- ID
- ZDB-FIG-221211-141
- Publication
- Michel et al., 2022 - Diversification of habenular organization and asymmetries in teleosts: Insights from the Atlantic salmon and European eel
- Other Figures
- All Figure Page
- Back to All Figure Page
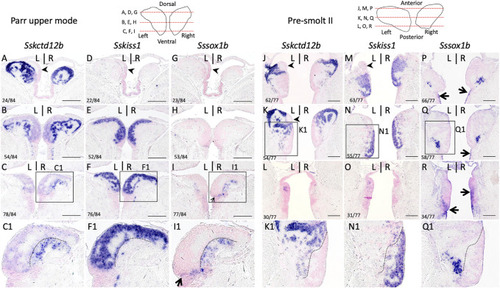
Subdomain organization of habenulae in Atlantic salmon during smoltification. (A–R) respectively show sections of parr upper mode and pre-smolt II specimens following ISH with probes for Sskctd12b (A–C,J–L), Sskiss1 (D–F,M–O) and SsSox1b (G–I,P–R). (A–I) are horizontal sections, (J–R) transverse sections. Schemes in the upper line show the levels of the sections along the dorso-ventral (A–I) or antero-posterior (J–Q) axis as indicated. The numbers of the sections shown along these axes are also indicated in the bottom left corner of the photographs. (C1,F1,I1) and (K1,N1,Q1) show higher magnifications of the areas boxed in (C,F,I) and (K,N,Q). Dotted lines in (F1) and (N1) and in adjacent sections (C1,I1) and (K1,Q1) delineate the posterior (F1) and dorsal (N1) limits of Sskiss1 territory, which largely exclude Sskctd12b and Sssox1b signals. Black arrowheads in (A,J,K) point towards a left dorsal territory negative for SsKctd12b and expressing pax6 (see below). Scale bars = 200 µm. |