
FIGURE 1
- ID
- ZDB-FIG-221211-140
- Publication
- Michel et al., 2022 - Diversification of habenular organization and asymmetries in teleosts: Insights from the Atlantic salmon and European eel
- Other Figures
- All Figure Page
- Back to All Figure Page
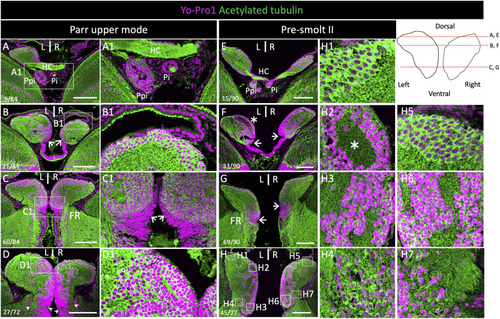
Cytoarchitecture of habenulae in Atlantic salmon during smoltification. (A–D) and (E–H) show histological sections of the habenulae in parr upper mode and pre-smolt II respectively, following nuclear staining using Yo-Pro1 (purple) and IHC with an antibody directed against acetylated tubulin (green). (A–G) are horizontal sections, (D,H) are transverse sections. (A1–D1) and (H1–H7) are higher magnification views of the areas boxed in (A–D) and (H) respectively. Arrowheads in (D) and (H) delimit the ventral border of habenulae. Thin arrows in (B), (C-C1), (F) and (G) point towards ventricular cells harboring a pseudo-stratified neuroepithelium organization. Values in the bottom left corner of (E–F) refer section numbers from dorsal to ventral habenula levels in (A–C) and (E–G) and from anterior to posterior habenula levels in (D,H). The levels of horizontal sections are also shown by red lines in the scheme in the upper right panel. Abbreviations: FR, fasciculus retroflexus; HC, habenular commissure; L/R, Left/Right; Pi, pineal organ; Ppi, and parapineal organ. Scale bar = 200 µm. |