
Fig. 8
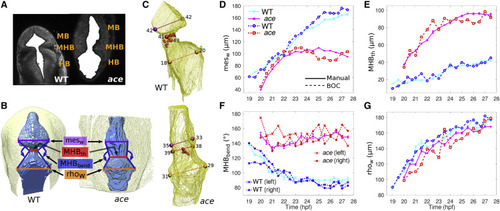
Figure 8. Measuring phenotype characteristics. (A) Extracted ventricle (solid white) from one slice of WT and ace embryos at 25 hpf. (B) 3D rendering of extracted ventricle images (blue) and embryo outline (yellow) visualized using UCSF Chimera (20). Renderings were manually oriented such that the dorsal side is facing out of the page. Measured structures are labeled. (C) 3D meshes of WT and ace embryo ventricles. Measured widths are colored in the same way as in (B). Positions marked by spheres are automatically located. MHB positions are denoted by small red spheres. Larger spheres mark the ventricles and MHB constriction. The number next to each sphere corresponds to the slice on which the sphere is located. See Fig. S5 for a detailed illustration of the automated measurement procedure. (D–G) Plots comparing voxel-based manual measurements (thick solid lines) and automated BOC-based (dashed) measurements for the two phenotypes. Manual measurements of MHBbend (F) were taken for the right side only. BOC-based MHBbend is measured between the vectors formed from the MHB constriction to the mesencephalic ventricle position and from the MHB constriction to the rhombencephalic ventricle position on each respective side. Error bars represent standard deviation of five manual measurements. Some error bars may be covered by marker symbols. |