
Fig. 1
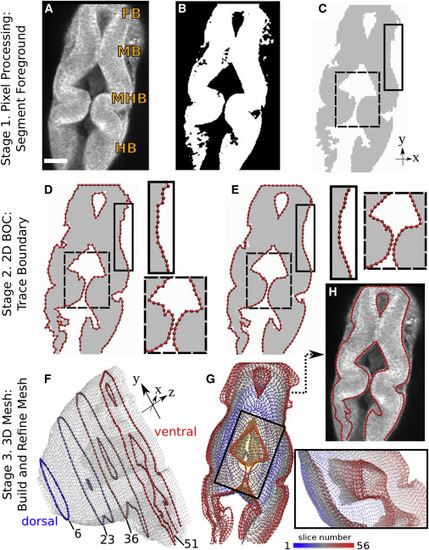
Figure 1. Methodology overview. (A) Image slice 51 (150 μm from the dorsal plane, shown in F) from WT zebrafish embryo time-lapse set at 24 hpf obtained via multiphoton microscopy. FB, forebrain; MB, midbrain; HB, hindbrain; MHB, midbrain-hindbrain boundary. Scale bars, 50 μm. (B) Binary filtering. (C) Image after noise removal and region extraction; colors are inverted and intensity is adjusted for presentation. (D) Initial 2D BOC (linearly connected red spheres). Note the rough outline. (E) After refinement, contour is smoother. Insets correspond to solid and dashed rectangles in (C). (F) Refined 3D mesh. There are 56 slices, imaged 3 μm apart. The z dimension is exaggerated to show the 2D BOC of slices 6, 23, 36, and 51. (G) Mesh in (F) viewed from the ventral side. Color scale from 1 to 56 corresponds to slice number from dorsal to ventral planes. Inset is view of the rectangle looking into the mesh from the top left corner. View is rotated 130° counterclockwise about the y axis. Part of the outer mesh is hidden in the viewing plane to reveal the inner mesh. (H) 2D BOC of slice 51 after stage 3 refinement. Note the further refined regions compared to (E). BOC is overlaid onto the original image in (A) for comparison. |