
Fig. 2
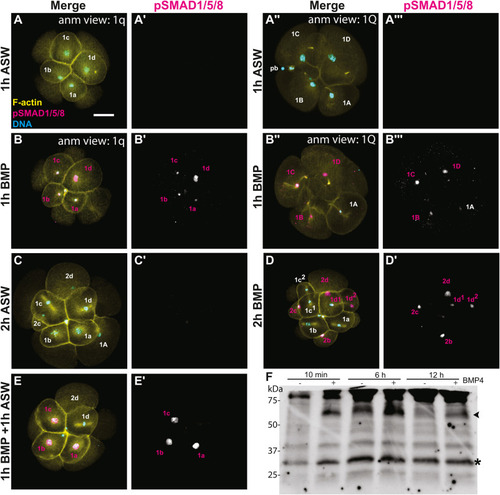
Fig. 2. Increase in pSMAD1/5/8 after BMP exposure. (A–E) z-stacked images of immunostaining, A) 1 h ASW treatment (8 cell embryo). B) 1 h BMP treatment (8 cell embryo). C) 2 h ASW treatment (10 cell embryo). D) 2 h BMP treatment (13 cell). E) 1 h BMP followed by 1 h ASW treatment (9 cell embryo). (A–D) merged micromeres; (A′-D′) pSMAD1/5/8 from (A–D); (A″-D″) merged macromeres, (A‴-D‴) pSMAD1/5/8 from (A″-D″). yellow: F-actin; magenta: pSMAD1/5/8; cyan: DNA. F) western blot of pSMAD1/5/8 on 2q animals with either mock (−) or BMP (+) for 10min, 6 h, or 12 h (n = 80 per lane). ∗, presumed pSMAD1/5/8; arrowhead, unknown band, see text. |
Reprinted from Developmental Biology, 478, Webster, N.B., Corbet, M., Sur, A., Meyer, N.P., Role of BMP signaling during early development of the annelid Capitella teleta, 183-204, Copyright (2021) with permission from Elsevier. Full text @ Dev. Biol.