
Fig 1
- ID
- ZDB-FIG-221121-8
- Publication
- Sarmah et al., 2022 - Elf3 deficiency during zebrafish development alters extracellular matrix organization and disrupts tissue morphogenesis
- Other Figures
- All Figure Page
- Back to All Figure Page
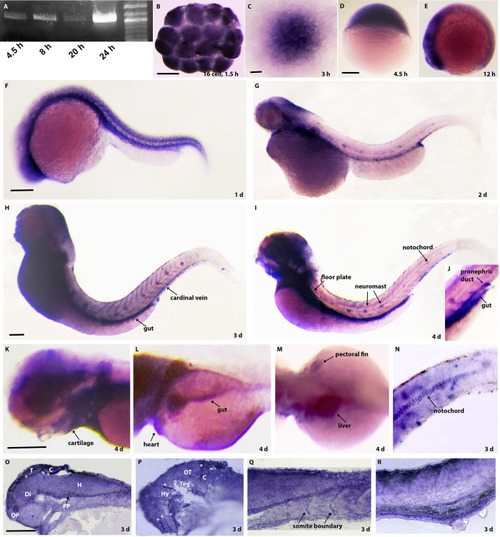
Expression of elf3 mRNA during zebrafish development.
(A) PCR detects elf3 mRNA during blastula (4.5 hpf), gastrula (8 hpf), and somitogenesis (20 and 24 hpf) stages. (B) In situ hybridization analysis shows elf3 mRNA expression in the 16 cell-stage embryos confirming maternal deposition. (C-D) During cleavage and blastula stages, elf3 mRNA is ubiquitously expressed. (E) During early somitogenesis period, elf3 mRNA is expressed more in the anterior region compared to the posterior region. (D-I) In situ hybridization detecting elf3 expression in 1 to 4 dpf larvae shows mRNA expression in distinct tissues. (J-N) High magnification images of 4 dpf stained larvae show elf3 mRNA expression in gut, pronephric duct (J), eye, cartilage (K), gut, heart (L), liver, pectoral fin (M), and in notochord (N). (O-R) 10 μM cryosections of the stained 3 dpf larvae show elf3 mRNA expression in different brain tissues and higher expressions in the boundaries of those tissues (O, P), in somite boundaries (Q) and in the gut and pronephric duct (R). T: telencephalon; C: cerebellum; OP: olfactory pit; Di: diencephalon; FP: floor plate; H: hindbrain; OT: optic tectum; Teg: tegmentum, Hy: hypothalamus; white asterisk: tissue boundary. Scale bar for B; C; D-E; F-G; H-I; K-M; and O-R = 200 μm. |