
FIGURE
FIGURE 5
- ID
- ZDB-FIG-221118-167
- Publication
- Ikkala et al., 2022 - Zebrafish cornea formation and homeostasis reveal a slow maturation process, similarly to terrestrial vertebrates' corneas
- Other Figures
- All Figure Page
- Back to All Figure Page
FIGURE 5
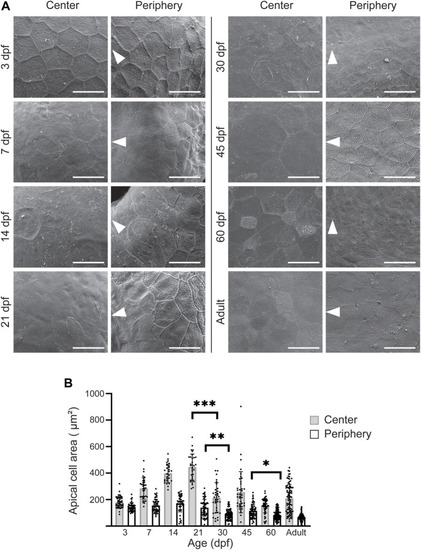
Apical cell appearance on zebrafish cornea. (A) Representative images of the central and peripheral regions. The white arrowheads point to the center of the eye. Scale bars: 20 µm. (B) Quantification of the apical cell area on central (gray) and peripheral (white) cornea. Cells from 3 eyes from 3 animals were pooled per age group for analysis (n = 27–87 in center, 47–121 in periphery, Kruskal-Wallis test with Dunn’s multiple comparisons test). The results represent mean ± SD. |
Expression Data
Expression Detail
Antibody Labeling
Phenotype Data
Phenotype Detail
Acknowledgments
This image is the copyrighted work of the attributed author or publisher, and
ZFIN has permission only to display this image to its users.
Additional permissions should be obtained from the applicable author or publisher of the image.
Full text @ Front. Physiol.