
FIGURE
Figure 2
- ID
- ZDB-FIG-221109-40
- Publication
- van Gelderen et al., 2022 - Deciphering sex-specific miRNAs as heat-recorders in zebrafish
- Other Figures
- All Figure Page
- Back to All Figure Page
Figure 2
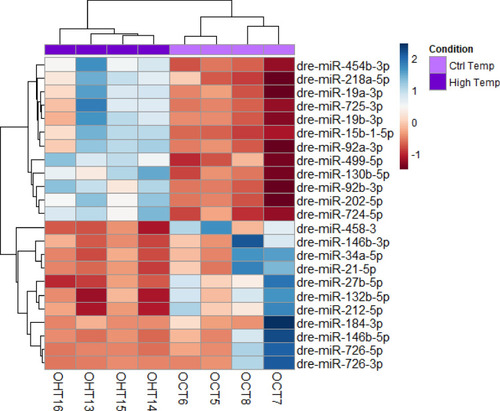
Heatmap of 23 differentially expressed (DE) miRNAs in mature ovaries after exposing zebrafish to high temperature during sex differentiation. The color scale ranges from blue to red, where blue shows relative overexpression and red is relative under expression. Both miRNAs and samples were grouped by hierarchical clustering. |
Expression Data
Expression Detail
Antibody Labeling
Phenotype Data
Phenotype Detail
Acknowledgments
This image is the copyrighted work of the attributed author or publisher, and
ZFIN has permission only to display this image to its users.
Additional permissions should be obtained from the applicable author or publisher of the image.
Full text @ Sci. Rep.