
Image
|
Figure Caption
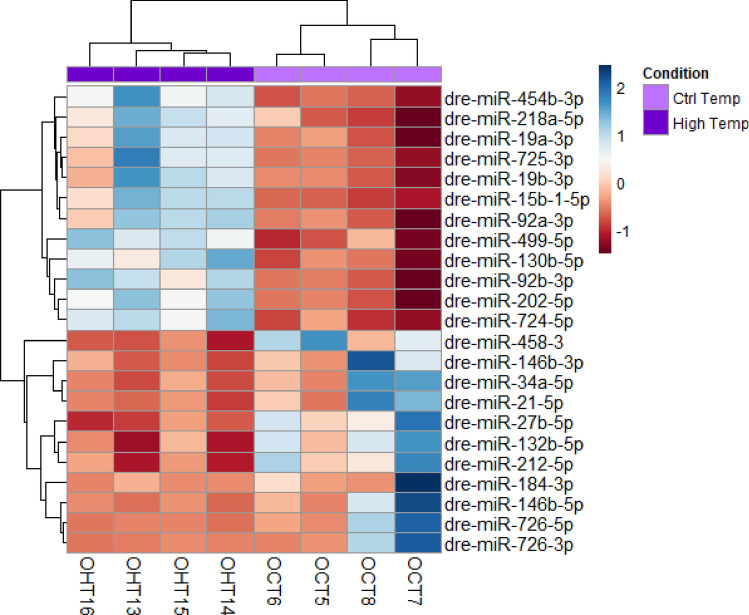
Figure 2
Heatmap of 23 differentially expressed (DE) miRNAs in mature ovaries after exposing zebrafish to high temperature during sex differentiation. The color scale ranges from blue to red, where blue shows relative overexpression and red is relative under expression. Both miRNAs and samples were grouped by hierarchical clustering.
Acknowledgments
This image is the copyrighted work of the attributed author or publisher, and
ZFIN has permission only to display this image to its users.
Additional permissions should be obtained from the applicable author or publisher of the image.
Full text @ Sci. Rep.