
Figure 5
- ID
- ZDB-FIG-221109-28
- Publication
- Blanc et al., 2022 - A dynamic and expandable Digital 3D-Atlas MAKER for monitoring the temporal changes in tissue growth during hindbrain morphogenesis
- Other Figures
- All Figure Page
- Back to All Figure Page
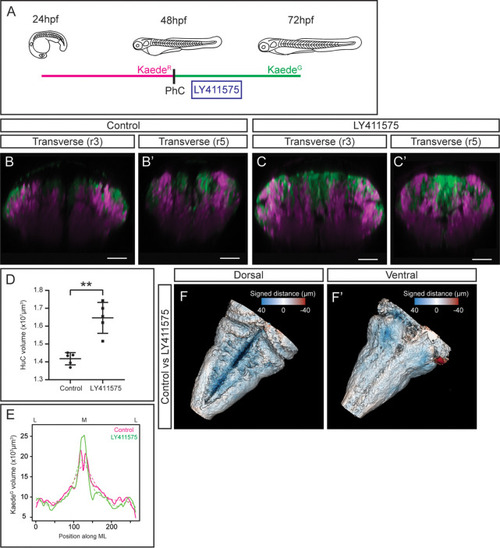
(A) Scheme with the outline of the experiment. HuC:KaedeGreen was photoconverted at 48hpf, embryos were incubated with the gamma-secretase inhibitor LY411575 during 4h, and imaged at 72hpf. As control, HuC:Kaede photoconverted non-treated embryos were used. (B–C, B’–C’) Transverse views through r3 and r5 of control (B–B’) and LY411575-treated (C–C’) embryos. Note the increase of the HuC:KaedeGreen domain upon conditionally inhibiting Notch-signaling, and the consequently remodeling of the HuC:KaedeRed domain. (D) Dot-plot displaying the neuronal differentiation volume in control and LY411575-treated embryos (n=5 embryos each). Welch’s two-tailed t-test; P<0.002 (**). Note the increase upon Notch-inhibition. (E) Quantification of the HuC:KaedeGreen volume in control and treated embryos along the ML axis. Note the accumulation of neurons in the medial differentiation domain of treated embryos. The average value is displayed as solid line and the non-linear regression as dashed line (n=5 embryos each). (F–F’) Shape comparison analysis of the neuronal differentiation domain between control and LY411575-treated embryos. Overlay of total 3D-neuronal volumes of control and treated embryos in dorsal (F) and ventral (F’) views. Color-coded legend indicates the signed distance between the two conditions. Note that the dorsal part is bluer compared with the ventral part, due to the accumulation of more neurons in this domain (n=5 embryos each). Scale bar, 50μm.
|