
Figure 2
- ID
- ZDB-FIG-221104-54
- Publication
- Crouzier et al., 2022 - NCS1 overexpression restored mitochondrial activity and behavioral alterations in a zebrafish model of Wolfram syndrome
- Other Figures
- All Figure Page
- Back to All Figure Page
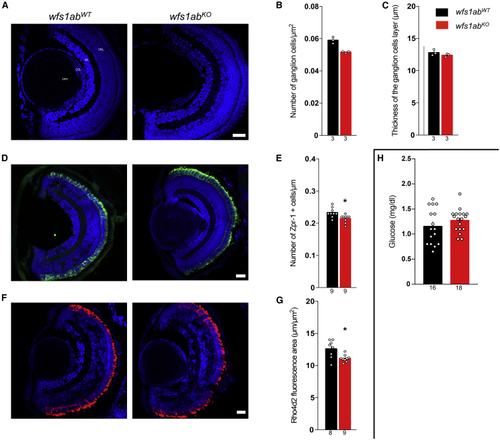
Morphological characterization of the retina and glycemia analysis of the wfs1abKO zebrafish line (A) Typical micrographs of the retina, (B) quantification of the number of ganglion cells, and (C) quantification of the thickness of the associated layer. Confocal images were obtained from sections from wfs1abWT and wfs1abKO zebrafish retina, showing cell nuclei labeled with 4′,6-diamidino-2-phenylindole (DAPI) (blue). (D and E) (D) Typical micrographs of the cones (green) and (E) quantification of photoreceptor cells (red and green cones) labeled with Zpr-1 antibody. (F and G) (F) Typical micrographs of the rods (red) and (G) quantification of rods labeled with Rho4d2 antibody. (H) Pancreas characterization with measurement of blood glucose on whole larvae. GCL, ganglion cell layer; INL, inner nuclear layer; ONL, outer nuclear layer. Scale bars, 50 μm in (A, D, and F). The number of animals is indicated in the columns. ∗p < 0.05; unpaired t test. |
| Antibodies: | |
|---|---|
| Fish: | |
| Anatomical Terms: | |
| Stage: | Day 5 |
| Fish: | |
|---|---|
| Observed In: | |
| Stage: | Day 5 |