
Fig. 5
- ID
- ZDB-FIG-221030-90
- Publication
- Zhao et al., 2021 - Identification of the Role of Wnt/β-Catenin Pathway Through Integrated Analyses and in vivo Experiments in Vitiligo
- Other Figures
- All Figure Page
- Back to All Figure Page
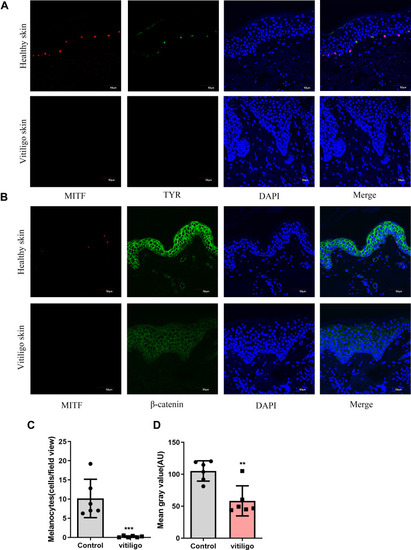
Melanocytes deficiency in vitiligo lesions; Impaired β-catenin expression in vitiligo lesions. (A) Representative images of the melanocytes in healthy skin samples (n = 6) and vitiligo lesions (n = 6) detected by immunofluorescence. Melanocytes were stained with antibody to TYR(green) and MITF(red). Nuclei were counterstained with DAPI(blue). Scale bar = 50μm; (B) Representative images of the expression of β-catenin (green) in healthy skin (n = 6) and vitiligo lesions (n = 6) detected using immunofluorescence. Melanocytes were stained with antibody to MITF(red). Nuclei were counterstained with DAPI(blue). Scale bar = 50 μm; (C) Each bar graph represents an average number of melanocytes per view field (20x) in one group (control, Mean±SD=10.17±2.049; vitiligo, Mean±SD=0.19±0.10). For each sample, five fields of view were randomly selected for counting. (D) Signal intensity of β-catenin was quantified by ImageJ software. Each bar graph represents the Mean±SD value of one group (control, Mean±SD=105.2±6.50 vitiligo, Mean±SD=58.37±9.64). For each sample, five fields of view were randomly selected for counting. P-values were calculated by unpaired t-test. (**P < 0.01,***P<0.001). |