
Fig. 3
- ID
- ZDB-FIG-221030-88
- Publication
- Zhao et al., 2021 - Identification of the Role of Wnt/β-Catenin Pathway Through Integrated Analyses and in vivo Experiments in Vitiligo
- Other Figures
- All Figure Page
- Back to All Figure Page
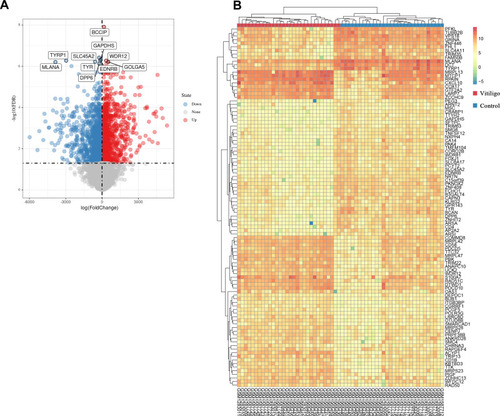
Differentially expressed genes (DEGs) between the vitiligo lesional skin group and non-lesional skin group among three datasets. (A) Volcano plot of DEGs for GSE75819, GSE53146 and GSE65127 datasets. The red and blue spots represented relative upregulated and downregulated DEGs based on |log fold change| >1 and adjusted P-value <0.05. The gray dots represented the genes with no statistically significant differences. The names of the top 10 DEGs are shown in the volcano plot. (B) Cluster heat map of the top 100 DEGs sorted by |log fold change| value. The color in heat maps from green to red shows the progression from low to high levels of gene expression. |