|
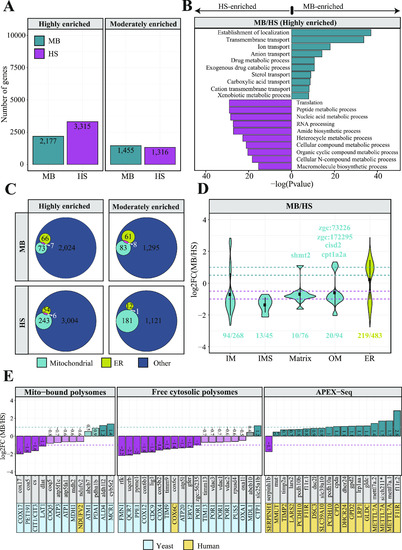
Subcellular localization of nuclear-encoded mitochondrial mRNAs.(A) Bar plots representing the total number of genes identified in MB and HS fractions obtained via biochemical fractionation of WT 5 dpf zebrafish samples and short-read Illumina RNA sequencing. (B) Gene Ontology (GO) enrichment for highly enriched genes in MB (2,177) and HS (3,315) fractions using biological process aspect. The results are shown as a negative log10P-value after Bonferroni correction. Bars in green indicate GO terms enriched for genes detected in MB fraction, whereas the purple bars represent the GO terms for the features identified in HS. For better representation of the results the bars enriched for genes in HS were transformed to be located on the left hand side of the plot. (C) Venn diagrams representing the number of mitochondrial genes from the merged MitoCarta 2.0 (Calvo et al, 2016) and IMPI repository, as well as the zebrafish orthologues of human 483 genes encoding proteins that localize to ER according to the Human Protein Atlas, identified in MB or HS fraction from WT samples. (D) Violin plot showing the distribution of log2 gene enrichments for genes grouped by their location within mitochondria. (E) ER genes were also included in this analysis (E) Bar plots showing the log2 gene enrichments of yeast (blue) and human (yellow) orthologous genes for which transcripts were reported to be translated by the mitochondrion-bound or free cytosolic polysomes.
|