|
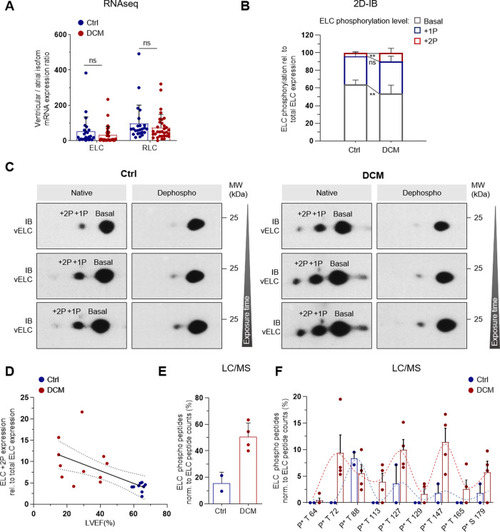
ELC-phosphorylation is regulated in human dilated cardiomyopathy.A Ratio of ventricular (v) MLC and atrial (a) MLC mRNA expression in human left ventricular tissue of DCM patients and HTX controls (HTX: n = 28; DCM: n = 44). Samples were analyzed by deep mRNA sequencing (mRNAseq)38. Data are mean ± SEM. Statistical significance was tested by two-tailed unpaired Student’s t-test. B Quantification of relative basal (Basal) and phosphorylated (+1P, + 2P) ELC protein illustrated as averaged intensity normalized to total ELC protein (Control: n = 9; DCM: n = 11). 6 HTX controls (Supplementary Table 1) and 3 healthy controls were included. Data are mean ± SD. **P < 0.01 by the analysis of two-tailed unpaired Student’s t-test. C Representative ELC 2D immunoblot (IB) of human LV heart tissue of a DCM patient and a healthy control. Native ELC protein forms (left panel) and ELC protein forms after in-vitro dephosphorylation (right panel). Exposure times were varied from 1 to 5 min. D Correlation analysis of phosphorylated ELC expression (+2P) and left ventricular ejection fraction (LVEF). R = −0.6193 and P = 0.0036 by the analysis of two-tailed Pearson Correlation (Control: n = 9; DCM: n = 11). E Sum of phospho peptides detected in spot arrays assigned to ventricular (v) ELC (see Fig. 7A, B) normalized to total ELC peptide counts. Proteins were separated by 2D electrophoresis and selected spot areas were analyzed by liquid chromatography followed by mass spectrometry (LC-MS) (DCM: n = 4; Ctrl: n = 2). Data are mean ± SD and are shown without statistical analysis. F Distribution of ELC-phosphorylation in DCM patients compared to healthy controls (Ctrl). Normalized amount of ELC phospho-peptides shown for the respective ELC-phosphorylation site (DCM: n = 4; Ctrl: n = 2). Data are mean ± SEM and are shown without statistical analysis.
|