|
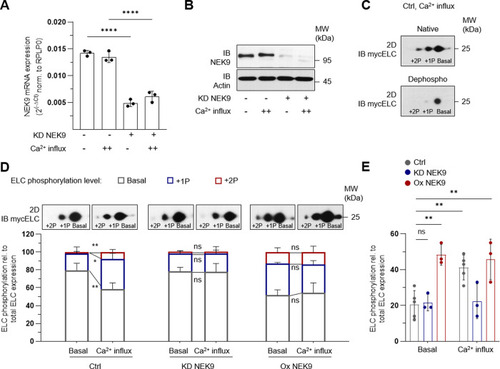
NEK9 regulates ELC-phosphorylation pattern in-vitro.A Validation of siRNA mediated knockdown (KD) of NEK9 in HEK293 cells by quantitative real time PCR. mRNA expression shown as 2(−ΔCt) normalized to RPLP0 (ribosomal protein large subunit P0). Ca2+-influx was obtained by ionophore stimulation. Data are mean ± SD (n = 3). ****P < 0.0001 by analysis of ordinary one-way ANOVA followed by Bonferroni’s multiple comparisons test. B Representative immunoblot (IB) of NEK9 protein expression after specific knockdown (KD). C 2D immunoblot of ELC-phosphorylation pattern after myc-tagged ELC overexpression and Ca2+ -influx using myc-specific antibody. After protein isolation samples were split and half of the sample was treated with phosphatase inhibitor (Native) and the other half was incubated with phosphatase (Dephospho). D Representative 2D immunoblot of myc-tagged ELC-phosphorylation pattern using myc-specific antibody (above) and ELC-phosphorylation illustrated as averaged intensity normalized to total ELC protein (down). ELC-phosphorylation was analyzed after myc-tagged ELC overexpression and siRNA knockdown (KD) of NEK9 or after overexpression (Ox) of NEK9 in human cells. Ca2+-influx was obtained by ionophore stimulation. Data are mean ± SD (n = 3, n = 5 for Ctrl group). *P < 0.05, **P < 0.01 by the analysis of two-tailed paired Student’s t-test. E Relative ELC protein phosphorylation (sum of phosphorylated (+1P + 2P) ELC forms) illustrated as averaged intensity normalized to total ELC protein. Data are mean ± SD (n = 3, n = 5 for Ctrl group). **P < 0.01 by the analysis of ordinary one-way ANOVA followed by Bonferroni’s multiple comparisons test.
|