FIGURE 2
- ID
- ZDB-FIG-221018-63
- Publication
- De Meulemeester et al., 2022 - Hyperactivation of mTORC1 in a double hit mutant zebrafish model of tuberous sclerosis complex causes increased seizure susceptibility and neurodevelopmental abnormalities
- Other Figures
- All Figure Page
- Back to All Figure Page
|
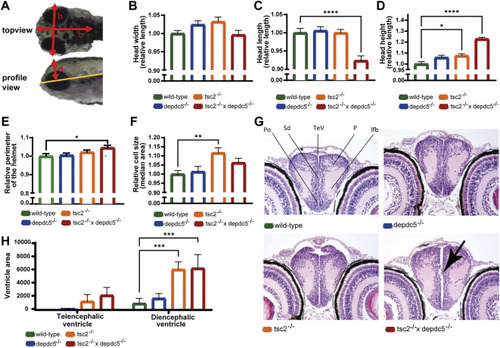
Analysis of the brain abnormalities by microscopy and histology. (A) Different head parameters measured in wild-type, depdc5–/–, tsc2–/–, and double homozygous larvae, with arrows indicating the head width (B), head length (C), head height (D) and head helmet (E). (B–E) Quantification of the head width (B), head length (C), head height (D) and helmet perimeter (E) of wild-type, depdc5 −/−, tsc2 −/−, and double homozygous larvae at 5 dpf. Absolute lengths were normalized against the wild-type group and relative lengths are reported. Data are presented as mean ± SEM, n = 8–11 larvae/condition. Significant values (one-way ANOVA) are noted as****p < 0.0001, *p < 0.05. (F) Quantification of the median cell size of EGFP-labelled GABAergic cells in the optic tectum. Data are presented as median ±SEM, n = 12–20 larvae/condition. Significant values (one-way ANOVA) are noted as **p < 0.001. (G) Representative 40x images of the anterior diencephalon in wild-type, depdc5 −/−, tsc2 −/− and double homozygous larvae at 5 dpf. n = 4 larvae/group. Black arrow indicates the protrusion of cells into the ventricle. (H) Quantification of the ventricle area in the pallial and posterior diencephalic area. Data are presented as mean ± SEM, n = 4 larvae/condition. Significant values (one-way ANOVA) are noted as ***p < 0.001. |

