FIGURE 1
- ID
- ZDB-FIG-221018-62
- Publication
- De Meulemeester et al., 2022 - Hyperactivation of mTORC1 in a double hit mutant zebrafish model of tuberous sclerosis complex causes increased seizure susceptibility and neurodevelopmental abnormalities
- Other Figures
- All Figure Page
- Back to All Figure Page
|
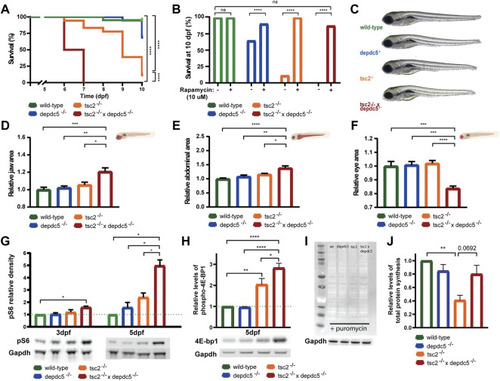
Survival analysis and morphological alterations in double homozygous larvae. (A) Kaplan-Meier curves of wild-type, depdc5 −/−, tsc2 −/−, and double homozygous larvae. Viability of larvae was assessed daily from 0 dpf until 10 dpf. Significant values (Log rank test) are noted as ****p < 0.0001. (B) Survival proportions at 10 dpf of wild-type, depdc5 −/−, tsc2 −/−, and double homozygous larvae with or without 10 μM rapamycin treatment. Significant values (one-way ANOVA) are noted as ****p < 0.0001. (C) Representative images of 5 dpf wild-type, depdc5 −/−, tsc2 −/−, and double homozygous larvae. (D)–(F) Quantification of jaw size (D), abdominal area (E) and eye size (F) in (C). Data are presented as mean ± SEM, n = 8–10 larvae/condition. Significant values (one-way ANOVA) are noted as ***p ≤ 0.001, **p ≤ 0.01 and *p ≤ 0.05. (G) Relative quantification of pS6 protein levels at 3 and 5 dpf in zebrafish heads of wild-type, depdc5 −/−, tsc2 −/−, and double homozygous larvae, normalized to Gapdh and represented as fold change expression versus wild-type. Representative blots for pS6 and Gapdh are shown below the graph. Data are presented as mean ± SEM, n = 3. Significant values (one-way ANOVA) are noted as ***p ≤ 0.001, **p ≤ 0.01 and *p ≤ 0.05. (H) Relative quantification of phospho-4E-bp1 protein levels at 5 dpf in zebrafish heads of wild-type, depdc5 −/− , tsc2 −/− , and double homozygous larvae, normalized to Gapdh and represented as fold change expression versus wild-type. Representative blots for phospho-4E-bp1 and Gapdh are shown below the graph. Data are presented as mean ± SEM, n = 4. Significant values (one-way ANOVA) are noted as ****p ≤ 0.0001, **p ≤ 0.01 and *p ≤ 0.05. (I) Representative blot of SUnSET assay following the incorporation of puromycin into newly synthesized proteins in wild-type, depdc5 −/−, tsc2 −/−, and double homozygous larvae at 5 dpf. Gapdh was used as loading control and a representative blots for Gapdh is shown below the anti-puromycin blot. (J) The average intensity of puromycin signal, normalized to Gapdh signal and represented as fold change expression versus wild-type. Data are represented as ± SEM, n = 3. Significant values (one-way ANOVA) are noted as **p ≤ 0.01. |

