
FIGURE
Fig. 2
- ID
- ZDB-FIG-221018-2
- Publication
- Garcia-Concejo et al., 2021 - Protein kinase C family evolution in jawed vertebrates
- Other Figures
- All Figure Page
- Back to All Figure Page
Fig. 2
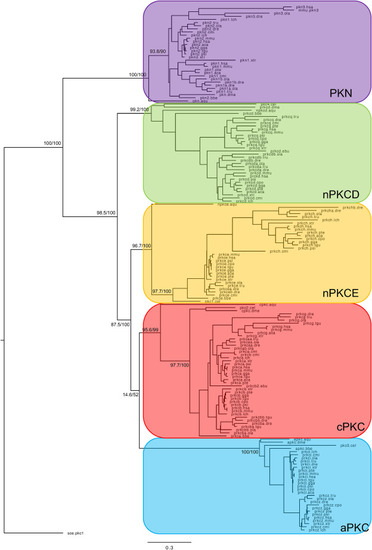
Fig. 2. Phylogenetic maximum likelihood tree of the PKC genes, rooted with the yeast PKC1 gene. The tree was generated using the kinase domain of each protein kinase. Each color corresponds to one PKC gene subfamily. Each subfamily contains a sequence from Amphimedon queenslandica, C. elegans and D. melanogaster. The tree topology is supported by a nonparametric Ultra-Fast Bootstrap (UFBoot) analysis. The complete tree values in Newick format are supported as supplementary data. |
Expression Data
Expression Detail
Antibody Labeling
Phenotype Data
Phenotype Detail
Acknowledgments
This image is the copyrighted work of the attributed author or publisher, and
ZFIN has permission only to display this image to its users.
Additional permissions should be obtained from the applicable author or publisher of the image.
Reprinted from Developmental Biology, 479, Garcia-Concejo, A., Larhammar, D., Protein kinase C family evolution in jawed vertebrates, 77-90, Copyright (2021) with permission from Elsevier. Full text @ Dev. Biol.