
Fig. 2
- ID
- ZDB-FIG-220922-47
- Publication
- Mondal et al., 2022 - A proliferative to invasive switch is mediated by srGAP1 downregulation through the activation of TGF-β2 signaling
- Other Figures
- All Figure Page
- Back to All Figure Page
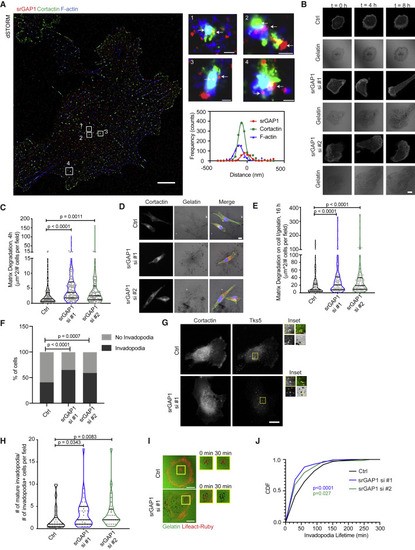
Figure 2. srGAP1 depletion increases matrix degradation by forming more mature invadopodia (A) Immunofluorescence demonstrating srGAP1, cortactin, and F-actin localization at invadopodia structures using direct STORM of MDA-MB-231 cells. Individual invadopodia noted by numbers and white boxes; arrows point to srGAP1 staining. Scale bars, 5 μm (for cell), 100 nm (for invadopodia #1, 4), 200 nm (for invadopodia #2, 3). For invadopodia #1, respective curve fitting of a region through invadopodia (bottom right). (B) Time-lapse images of control (Ctrl) or srGAP1 knockdown Lifeact-Ruby MDA-MB-231 cells using siRNAs (srGAP si #1, srGAP1 si #2) and respective matrix degradation on gelatin at 0, 4, and 8 h. Scale bar, 10 μm. (C) Matrix degradation of Ctrl, srGAP1 si #1, and srGAP1 si #2 MDA-MB-231 cells. Cells plated on fluorescent gelatin for 4 h. n = 114 (Ctrl), 116 (srGAP1 si #1), and 109 (srGAP1 si #2) fields quantified. Data from three independent experiments and represented as a violin plot, horizontal lines are median and interquartile range. Mann-Whitney U test, two-tailed. (D) Representative images of Ctrl, srGAP1 si #1, and srGAP1 si #2 MDA-MB-231 cells plated on fibrillar collagen I overlaid on fluorescent gelatin for 16 h. Left: cortactin; middle: gelatin matrix; right: cortactin (red)-, F-actin (green)-, DAPI (blue)-labeled tumor cells on the matrix. Scale bar, 10 μm. (E) Matrix degradation of Ctrl, srGAP1 si #1, and srGAP1 si #2 MDA-MB-231 cells plated on fibrillar collagen I overlaid on fluorescent gelatin for 16 h. n = 119 (Ctrl), 101 (srGAP1 si #1), and 113 (srGAP1 si #2) fields quantified. Data are from three independent experiments and represented as a violin plot; horizontal lines are median and interquartile range. Mann-Whitney U test, two-tailed. (F) Percent of Ctrl, srGAP1 si #1, and srGAP1 si #2 MDA-MB-231 cells with or without invadopodia at 4 h. n = 226 cells from 64 fields (Ctrl), 166 cells from 73 fields (srGAP1 si #1), 147 cells from 72 fields (srGAP1 si #2) pooled over three independent experiments. Chi-squared test. (G) Representative images of Ctrl and srGAP1 si #1 MDA-MB-231 cells on gelatin for 4 h. Left: cortactin; right: Tks5 staining. Scale bar, 10 μm. Inset scale bar, 1 μm. Top left: cortactin; bottom left: Tks5; bottom right: gelatin, Top right: merge of cortactin and Tks5. Mature invadopodia are labeled with cortactin and Tks5; black spots on gelatin matrix represent matrix degradation (yellow arrows point to colocalization of invadopodia and matrix degradation). (H) Number of mature invadopodia of Ctrl, srGAP1 si #1, and srGAP1 si #2 MDA-MB-231 cells at 4 h, n = 25 (Ctrl), n = 33 (srGAP1 si #1), n = 28 (srGAP1 si #2) fields. Data are from three independent experiments and represented as a violin plot; horizontal lines are median and interquartile range. Mann-Whitney U test, two-tailed. (I) Time-lapse images of invadopodia lifetime at 0 and 30 min. (Left) Lifeact-Ruby Ctrl and srGAP1 si #1 MDA-MB-231 cells on fluorescent gelatin at 0 min. Scale bar, 20 μm. Right panel: insets of mature invadopodia (red fluorescent puncta overlaid on black degradation spots) over time (0 and 30 min). (J) Cumulative distribution of invadopodia lifetimes of Ctrl, srGAP1 si #1, and srGAP1 si #2 MDA-MB-231 cells. n = 122 invadopodia from 10 cells (Ctrl), 317 invadopodia from 11 cells (srGAP1 si #1), and 169 invadopodia from 11 (srGAP1 si #2) cells. Data from three independent experiments. Kolmogorov-Smirnov test. |