
FIGURE
Fig. 4
- ID
- ZDB-FIG-220912-25
- Publication
- Kubra et al., 2022 - Phylogenetic and Expression Analysis of Fos Transcription Factors in Zebrafish
- Other Figures
- All Figure Page
- Back to All Figure Page
Fig. 4
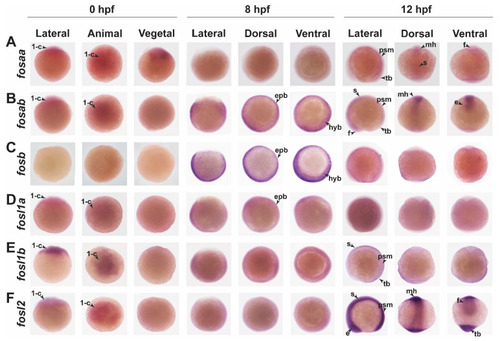
Spatiotemporal expression of fos genes during early zebrafish embryonic development. Lateral, dorsal, and frontal views of 0 hpf, 8 hpf, and 12 hpf zebrafish embryos analysed by WISH showing expression for fosaa (A), fosab (B), fosb (C), fosl1a (D), fosl1b (E), and fosl2 (F). 1-c, one cell; e, eye; epb, epiblast; f, forebrain; hyb, hypoblast; mh, mid and hindbrain; psm, presomitic mesoderm; s, somite; tb, tailbud. Black arrows within each panel point to the specific expression indicated by the abbreviation. |
Expression Data
| Genes: | |
|---|---|
| Fish: | |
| Anatomical Terms: | |
| Stage Range: | 1-cell to 5-9 somites |
Expression Detail
Antibody Labeling
Phenotype Data
Phenotype Detail
Acknowledgments
This image is the copyrighted work of the attributed author or publisher, and
ZFIN has permission only to display this image to its users.
Additional permissions should be obtained from the applicable author or publisher of the image.
Full text @ Int. J. Mol. Sci.