
Fig. 7
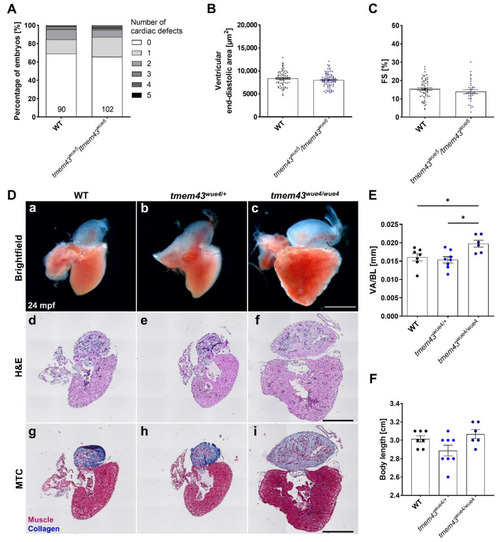
Enlarged adult hearts of homozygous tmem43wue4/wue4 mutant fish. (A) Phenotyping showing the percentage of embryos with zero to five different cardiac-specific defects. The defects were classified in looping defects, pericardial edemas, arrhythmias, altered ventricular shape, strong ventricular contractions, heterogenous ventricular contractions, and altered atrial shape. The number of analyzed embryos is indicated at the bottom of the columns. (B) Quantification of ventricular end-diastolic area showing the mean area of three individual sections of each fish from a time series of the embryonic cardiac cycle. (C) Analysis of cardiac function by quantification of ventricular fractional shortening (FS) from a time series of the embryonic cardiac cycle. Data points represent the average measurement obtained from three diastolic/systolic phases of each fish. The short axis of the ventricle was used for quantification. (A–C) Analyses were performed on embryos from three independent clutches per genotype. (B,C) Significance was determined by an unpaired t-test. Error bars correspond to SEM. (D) Adult cardiac morphology at 24 months post fertilization (mpf). Scale bars = 500 µm. (a–c) Representative brightfield images of dissected fish hearts. (d–f) Histology was analyzed by H&E staining (n = 5 hearts per genotype). (g–i) Fibrosis was analyzed by MTC staining (n = 5 hearts per genotype). (E) Quantification of ventricular area to body length ratio (VA/BL) reveals significant ventricular enlargement in homozygous tmem43wue4/wue4 zebrafish. Brightfield images represented in (a–c) were used for assessment of ventricular surface area. (F) Quantification of body length reveals normal growth and development in adult tmem43 mutants. (E,F) Significance was determined by one-way ANOVA with Bonferroni’s multiple comparison test, * p ≤ 0.05. Error bars correspond to SEM. |
| Fish: | |
|---|---|
| Observed In: | |
| Stage Range: | Protruding-mouth to Adult |