
Fig. 6
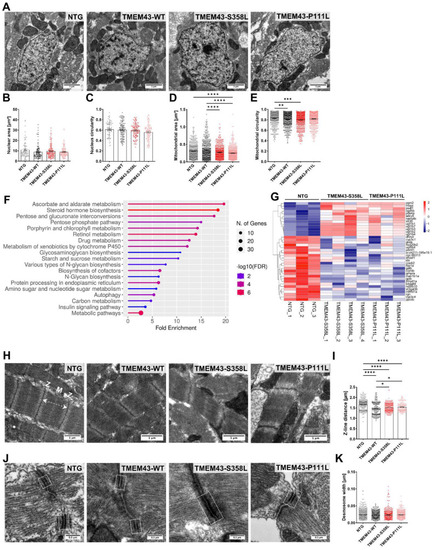
Transmission electron microscopy (TEM) reveals altered ultrastructure in ventricular heart tissue from TMEM43 transgenic lines at 5 months post-fertilization. (A) TEM images showing nuclei and mitochondria of the ventricular myocardium. Scale bars = 1 µm. (B) Analysis of the nuclear area and (C) circularity demonstrate no alterations between the genotypes. (D) Assessment of mitochondrial area uncovers significantly reduced mitochondrial size in both TMEM43 variant lines compared to TMEM43-WT. (E) Evaluation of mitochondrial circularity revealed altered mitochondrial shape in TMEM43-S358L and TMEM43-WT ventricles compared to the non-transgenic control (NTG). (F) Kyoto Encyclopedia of Genes and Genomes (KEGG) pathway enrichment analysis for shared differently expressed genes (DEGs) between “NTG vs. TMEM43-S358L” and “NTG vs. TMEM43-P111L” (padj. ≤ 0.05) using ShinyGO v0.76. The x-axis represents fold enrichment and y-axis represents enriched KEGG terms. The size of the dots represents the number of involved genes. The false discovery rate (FDR) value is indicated by colors. (G) Heatmap showing DEGs belonging to the KEGG pathway “Metabolic pathways”. (H) Representative TEM images of longitudinal sections of sarcomeres showing proper myofibrill organization. Dashed double-headed arrow indicates distance between two Z-discs. M, M-line; Z, Z-line. Scale bars = 1 µm. (I) Quantification of Z-line distance of sarcomeres represented in (H) reveals a significantly increased sarcomere length in both TMEM43 variant lines compared to the TMEM43-WT. NTG displayed the highest sarcomere length. (J) TEM images showing desmosomes of the ventricular myocardium. Dashed boxes indicate desmosomal junctions. Scale bars = 0.3 µm. (B–E,I,K) For all graphs, significance was determined by one-way ANOVA with Bonferroni’s multiple comparison test, * p ≤ 0.05, ** p ≤ 0.01, *** p ≤ 0.001, **** p ≤ 0.0001. Error bars correspond to SEM. n ≥ 3 per genotype. |
| Fish: | |
|---|---|
| Observed In: | |
| Stage: | Adult |