
Fig. 5
|
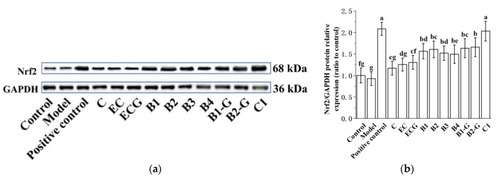
Effects of different structural procyanidins on the nuclear factor-erythroid 2-related factor 2 (Nrf2)/ARE Pathway in the PC12 cell PD model. (a) Protein levels of Nrf2, as determined by Western blotting. (b) Nrf2/GAPDH protein relative expression (ratio to control). (c) Protein expression levels of nuclear Nrf2 and cytoplasmic Nrf2, as determined by Western blotting. (d) Nuclear Nrf2/LaminB protein relative expression (ratio to control). (e) Cytoplasmic Nrf2/GAPDH protein relative expression (ratio to control). (f) Protein levels of HO-1 and NQO1, as determined by Western blotting; (g) HO-1/GAPDH protein relative expression (ratio to control). (h) NQO1/GAPDH protein relative expression (ratio to control). Control, Blank control group; Model, MPP+ (1.5 mM); Positive control, Deprenyl (30 μM) + MPP+ (1.5 mM); C: C (5 μM) + MPP+ (1.5 mM); EC: EC (5 μM) + MPP+ (1.5 mM); ECG: ECG (5 μM) + MPP+ (1.5 mM); B1: B1 (5 μM) + MPP+ (1.5 mM); B2: B2 (5 μM) + MPP+ (1.5 mM); B3: B3 (5 μM) + MPP+ (1.5 mM); B4: B4 (5 μM) + MPP+ (1.5 mM); B1-G: B1-G (5 μM) + MPP+ (1.5 mM); B2-G: B2-G (5 μM) + MPP+ (1.5 mM); C1: C1(5 μM) + MPP+ (1.5 mM). Data are expressed as the mean ± SD. All experiments were conducted three times. Different letters (a–g) on the bar represent significant differences, while the same letters represent no significant differences (p < 0.05, one-way ANOVA). 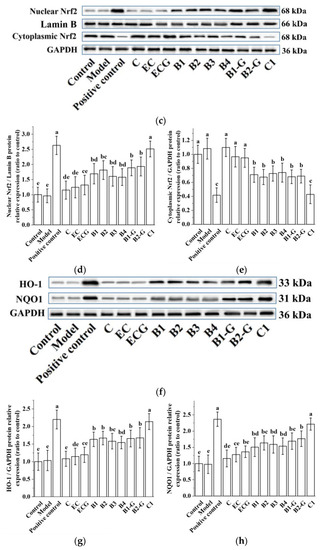
|