
Fig. 4
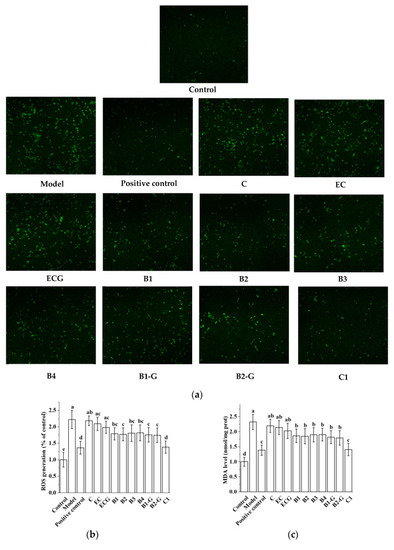
Effects of different structural procyanidins on oxidative stress in the PC12 cell PD model. (a) Representative fluorescence photomicrographs of PC12 cells. (b) ROS level. (c) MDA level. (d,e) CAT activity. (f) SOD activity. Control, Blank control group; Model, MPP+ (1.5 mM); Positive control, Deprenyl (30 μM) + MPP+ (1.5 mM); C: C (5 μM) + MPP+ (1.5 mM); EC: EC (5 μM) + MPP+ (1.5 mM); ECG: ECG (5 μM) + MPP+ (1.5 mM); B1: B1 (5 μM) + MPP+ (1.5 mM); B2: B2 (5 μM) + MPP+ (1.5 mM); B3: B3 (5 μM) + MPP+ (1.5 mM); B4: B4 (5 μM) + MPP+ (1.5 mM); B1-G: B1-G (5 μM) + MPP+ (1.5 mM); B2-G: B2-G (5 μM) + MPP+ (1.5 mM); C1: C1(5 μM) + MPP+ (1.5 mM). Data are expressed as the mean ± SD. All experiments were conducted three times. Different letters (a–f) on the bar represent significant differences, while the same letters represent no significant differences (p < 0.05, one-way ANOVA). |