
FIGURE
Fig. 8
- ID
- ZDB-FIG-220808-52
- Publication
- Shang et al., 2022 - Fluorescent Imaging-Guided Chemo- and Photodynamic Therapy of Hepatocellular Carcinoma with HCPT@NMOFs-RGD Nanocomposites
- Other Figures
- All Figure Page
- Back to All Figure Page
Fig. 8
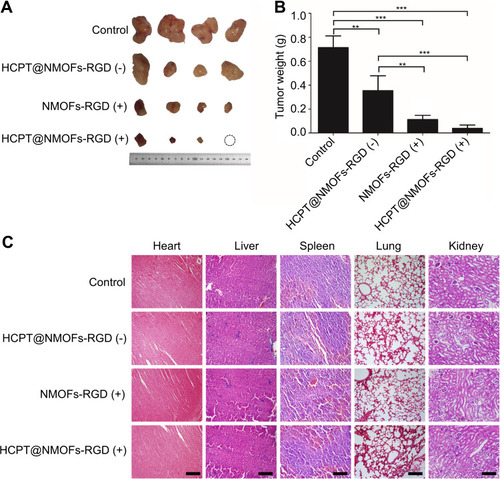
The reduction of tumors in HCC-bearing mice following chemo-, photodynamic-, and synergistic therapy. (A) Images of tumors following different treatments at 12 days post treatment (dpt). Note that one tumor in the HCPT@NMOFs-RGD (+) group completely disappeared. (B) Statistical analysis of tumor weight at 12 dpt (ANOVA; **P<0.01, ***P<0.001). (C) Images of HE staining of the heart, liver, spleen, lung and kidney. “(+)” and “(−)” represent samples with or without laser irradiation at 655 nm, respectively. Scale bar in (C): 50 μm. |
Expression Data
Expression Detail
Antibody Labeling
Phenotype Data
Phenotype Detail
Acknowledgments
This image is the copyrighted work of the attributed author or publisher, and
ZFIN has permission only to display this image to its users.
Additional permissions should be obtained from the applicable author or publisher of the image.
Full text @ Int. J. Nanomedicine