
FIGURE
Fig. 2
- ID
- ZDB-FIG-220808-46
- Publication
- Shang et al., 2022 - Fluorescent Imaging-Guided Chemo- and Photodynamic Therapy of Hepatocellular Carcinoma with HCPT@NMOFs-RGD Nanocomposites
- Other Figures
- All Figure Page
- Back to All Figure Page
Fig. 2
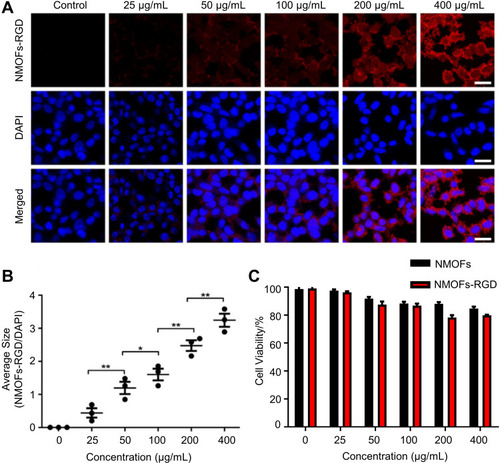
In vitro fluorescence imaging and cytotoxicity of NMOFs-RGD. (A) Fluorescence images of HepG2 cells exposed to NMOFs-RGD. Red signals are from NMOFs-RGD. Note that NMOFs-RGD are localized at the membrane and in the cytoplasm. (B) Statistical analysis of fluorescence intensity in NMOFs-RGD-incubated cells (Student’s t-test; *P<0.05, **P<0.01). (C) Statistical analysis of cell viability in HepG2 cells incubated with NMOFs (control) and NMOFs-RGD. Scale bar in (A): 20 μm. |
Expression Data
Expression Detail
Antibody Labeling
Phenotype Data
Phenotype Detail
Acknowledgments
This image is the copyrighted work of the attributed author or publisher, and
ZFIN has permission only to display this image to its users.
Additional permissions should be obtained from the applicable author or publisher of the image.
Full text @ Int. J. Nanomedicine