
FIGURE
Fig. 2
- ID
- ZDB-FIG-220805-37
- Publication
- Makarova et al., 2022 - Benchtop X-band electron paramagnetic resonance detection of melanin and Nitroxyl spin probe in zebrafish
- Other Figures
- All Figure Page
- Back to All Figure Page
Fig. 2
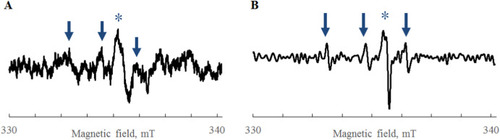
Fig. 2. EPR signal from 1 μM aqueous solution of 3-CP probe in standard 100 μL glass capillary, recorded at X-band benchtop EPR spectrometer. a) signal recorded with standard benchtop, 15dB/MA-100μT/ST-20s/16sc b) signal obtained with a use of eSpect+ 15dB/MA-500μT/ST-11s/16sc. The signal from glass impurities is marked with an asterisk (*), signals from 3-CP probe are marked with arrows. |
Expression Data
Expression Detail
Antibody Labeling
Phenotype Data
Phenotype Detail
Acknowledgments
This image is the copyrighted work of the attributed author or publisher, and
ZFIN has permission only to display this image to its users.
Additional permissions should be obtained from the applicable author or publisher of the image.
Reprinted from Free radical biology & medicine, 183, Makarova, K., Zawada, K., Wiweger, M., Benchtop X-band electron paramagnetic resonance detection of melanin and Nitroxyl spin probe in zebrafish, 69-74, Copyright (2022) with permission from Elsevier. Full text @ Free Radic. Biol. Med.