|
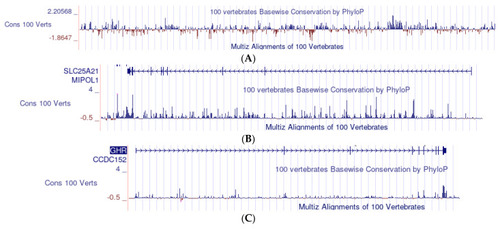
(A) An example of the analysis of conservation with the UCSC Genome Browser. The data, plotted as a bar graph, derive from the multialignment of 100 representative vertebrates. Each bar measures the average conservation/mutation of a series of 800 nucleotides; the blue bars (positive values) measure the conservation; the red bars (negative values) measure the mutation; the zero level is the conservation expected under neutral drift on the left of the scale (from −1.8647 to 2.20568). (B) SLC25A21: bar graph of the conservation profile in vertebrates. Each of the (minute) bars corresponds to 800 nucleotides. The series of arrows (top of the figure) indicate the direction of translation. The small vertical lines on the line of arrows mark the position of the exons. Other captions are the same as those in (A). (C) GHR: bar graph of the conservation profile in vertebrates. The same scale and other captions are used in (B), but each bar corresponds to 480 nucleotides.
|