
FIGURE 2
- ID
- ZDB-FIG-220722-11
- Publication
- Godivier et al., 2022 - Growth orientations, rather than heterogeneous growth rates, dominate jaw joint morphogenesis in the larval zebrafish
- Other Figures
- All Figure Page
- Back to All Figure Page
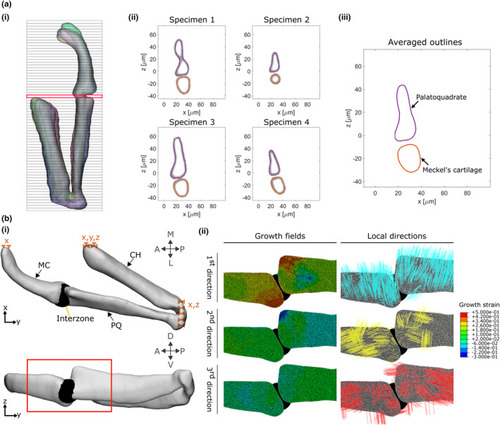
Integration of the growth maps in a finite element model. (a) The first step in constructing our FE model is to obtain an average geometry for each timepoint (3.5, 4, 4.5, 5 and 5.5 dpf). For each timepoint, half jaw shapes are aligned and sliced transversally (i). For each slice, the shape outlines of each sample (four here) are obtained (ii) then averaged (iii). The slice marked in red in (i) is shown as an example in (ii) and (iii). (b) (i) An FE model is generated based on the averaged shape outlines; the joint interzone is added and the areas marked with dashed triangles are constrained in the specified dimensions (e.g. x). (ii) Section of the joint in the lateral plane showing the growth fields which are applied to the model along with their associated directions. The view is marked by a red box in (i). A, anterior; CH, ceratohyal; L, lateral; M, medial; MC, Meckel's cartilage; P, posterior; PQ, palatoquadrate; D, dorsal; V, ventral |