
- Title
-
Growth orientations, rather than heterogeneous growth rates, dominate jaw joint morphogenesis in the larval zebrafish
- Authors
- Godivier, J., Lawrence, E.A., Wang, M., Hammond, C.L., Nowlan, N.C.
- Source
- Full text @ J. Anat.
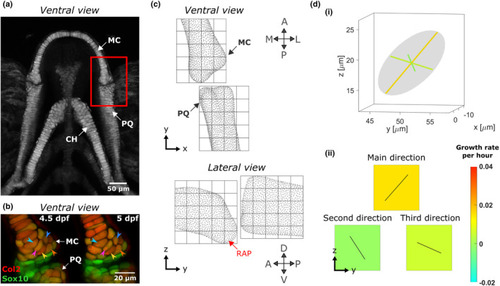
Growth map calculations in larval zebrafish jaw joint. (a) Maximum projection of ventral confocal image stacks of the jaw from a larval zebrafish aged 5 dpf expressing |
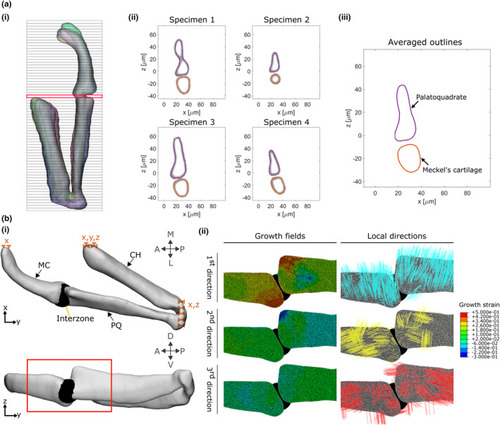
Integration of the growth maps in a finite element model. (a) The first step in constructing our FE model is to obtain an average geometry for each timepoint (3.5, 4, 4.5, 5 and 5.5 dpf). For each timepoint, half jaw shapes are aligned and sliced transversally (i). For each slice, the shape outlines of each sample (four here) are obtained (ii) then averaged (iii). The slice marked in red in (i) is shown as an example in (ii) and (iii). (b) (i) An FE model is generated based on the averaged shape outlines; the joint interzone is added and the areas marked with dashed triangles are constrained in the specified dimensions (e.g. x). (ii) Section of the joint in the lateral plane showing the growth fields which are applied to the model along with their associated directions. The view is marked by a red box in (i). A, anterior; CH, ceratohyal; L, lateral; M, medial; MC, Meckel's cartilage; P, posterior; PQ, palatoquadrate; D, dorsal; V, ventral |

Shape changes between 3.5 and 5.5 dpf in zebrafish jaws. Superimposed 3.5 (purple) and 5.5 (turquoise) dpf 3D average shapes and 3.5 to 5.5 dpf average shape outlines in the ventral and lateral planes. The shape features which change as the jaw develops are marked with specific symbols (diamond: MC length, square: MC width, circle: MC depth, triangle: PQ length, semi‐circle: PQ depth). A, anterior; D, dorsal; L, lateral; M, medial; MC, Meckel's cartilage; P, posterior; PQ, palatoquadrate; V, ventral |
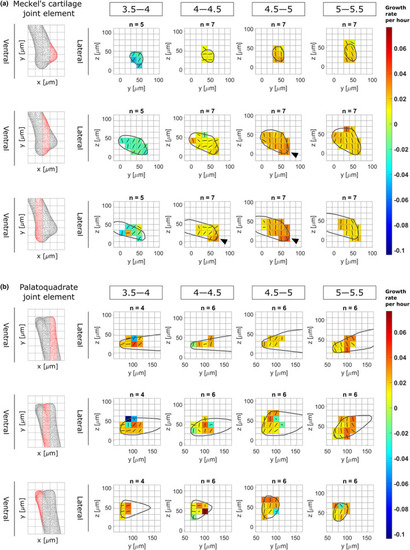
Growth rates from 3.5 to 5.5 dpf in zebrafish jaw joint exhibits spatial and temporal patterns. Maps showing growth rates along the main direction for growth (major axis of the ellipsoid) and their associated directions for each time window (3.5–4, 4–4.5, 4.5–5 and 5–5.5 dpf) in the anterior Meckel's cartilage (a) and posterior palatoquadrate (b) joint elements in the lateral plane. Growth rates are represented by colours, while the direction is shown by solid black lines. Results are displayed across the rudiment's width; views in the ventral plane of each section are displayed on the left panels. Black arrowheads show areas of elevated growth rates |
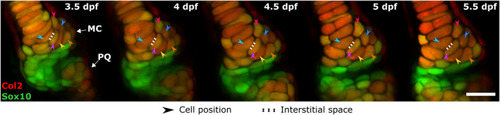
Cell intercalation and the extracellular matrix do not majorly contribute to jaw joint shaping. Representative ventral stacks of the anterior jaw joint element of a live specimen aged 3.5, 4, 4.5, 5 and 5.5 dpf expressing the transgenic reporters |

The integration of cell‐based data in an FE model successfully predicts zebrafish jaw shape changes from 3.5 to 5.5 dpf, with most faithful predictions from 4 to 4.5 dpf. The shape outlines for each time window are superimposed (blue: Initial shape, green: Target shape, orange: Predicted shape) and the shapes features introduced in Figure |
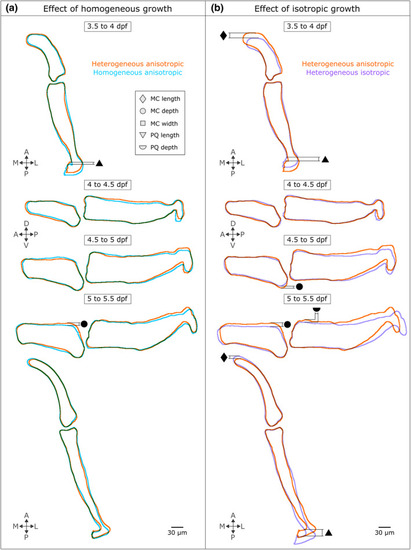
Growth orientation plays an important role in jaw joint shaping, whereas growth heterogeneity minorly impacts zebrafish jaw shape predictions. Growth predictions obtained from homogeneous anisotropic (a) and heterogeneous isotropic (b) growth fields are compared with the ‘full’ simulation (heterogeneous anisotropic). Only the views where shape changes were observed in either the homogeneous anisotropic or the heterogeneous isotropic shape predictions compared to the full simulation are displayed. The shape outlines in all views and time windows are displayed in Figures |