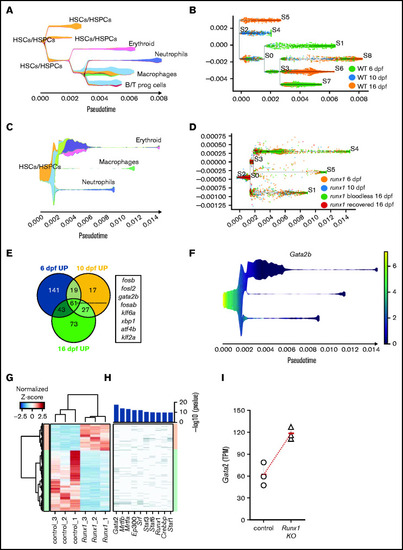
Gata2 is upregulated in the HSPCs of Runx1 zebrafish and mice knockouts. (A) Stream plot representing the pseudotime trajectory projection of wild-type cd41:GFPlow cells at 6, 10, and 16 dpf and their different identities. (B) Subway map depicting the distribution of wild-type cd41:GFPlow cells from different time points to the different branches. (C) Stream plot representing the pseudotime trajectory projection of runx1del8/del8 cd41:GFPlow cells at 6, 10, and 16 dpf and their different identities. (D) Subway map illustrating the contribution of runx1del8/del8 cd41:GFPlow at different time points to the different branches. (E) Venn diagram representing the number of upregulated genes in runx1del8/del8 HSC/HSPCs vs wild-type at 6, 10, and 16 dpf (Padj < .05, FC > 1.5). Sixty-one genes were commonly upregulated, of which 8 were transcription factors (listed). (F) Stream plot depicting the expression of gata2b in the runx1del8/del8 larval cd41-GFPlow pseudotime development (from panels C and D). See supplemental Figure 5 for additional analyses of hematopoietic differentiation trajectories in runx1del8/del8 and wild-type larvae at 6, 10, and 16 dpf. (G) Unsupervised hierarchical clustering of wild-type and Runx1−un RNAseq samples and heat map depicting the differentially expressed genes between wild-type and Runx1−un c-Kit+ HSPCs (940 downregulated and 414 upregulated in the Runx1−un; Padj < .05, FC > 2). (H) Top transcription factors enriched for regulating the differentially expressed genes. The x axis of the heatmap lists the transcription factors, and the y axis shows the DE genes sorted in the same order of the y axis in panel B. Bar plot on the top showed the enrichment P values for each transcription factor. (I) Gata2 expression in c-kit+ bone marrow cells in control and Runx1−/− mice, measured by RNA-seq. Round and triangle points mark transcripts per kilobase million values of each mouse in control and Runx1−/− mice, respectively. Red ticks mark the average transcripts per kilobase million value. See supplemental Figure 6 for additional data on Gata2 expression in Runx1 conditional knockout mice.
|
