
Fig. 6
- ID
- ZDB-FIG-220715-35
- Publication
- Chen et al., 2022 - Neuropathy-associated Fars2 deficiency affects neuronal development and potentiates neuronal apoptosis by impairing mitochondrial function
- Other Figures
- All Figure Page
- Back to All Figure Page
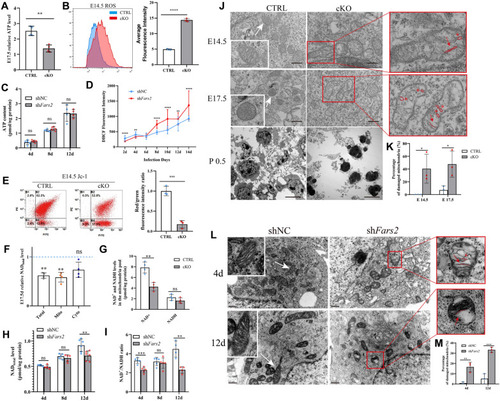
Effects of Fars2 deficiency on mitochondria. A–B ATP and ROS levels in the cortex of the cKO mouse embryo compared with control at E 14.5 (mean ± SD; Two-tailed unpaired t-Test, **P < 0.01; ****P < 0.0001; n = 6 for ATP; n = 3 for ROS). C–D TP and ROS levels in control and Fars2 knocked-down neurons at the indicated days of culture (mean ± SD; two-tailed unpaired t-Test, ns: non-significant; **P < 0.01; ****P < 0.0001; n = 4–5 for ATP; n = 27 for ROS). E Relative mitochondrial membrane potential in the cortex of the cKO mouse embryo compared with control at E 14.5 (mean ± SD; two-tailed unpaired t-Test, ***P < 0.001; n = 3). F Relative NADtotal level in the cortex of the cKO mouse embryo compared with control at E 17.5 (mean ± SD; two-tailed unpaired t-Test, ns: non-significant; **P < 0.01; n = 4). G NAD+ and NADH levels of mitochondria pool in control and cKO mice embryo cortex at E 17.5 (mean ± SD; two-tailed unpaired t-Test, ns: non-significant; **P < 0.01; n = 4). H–INADtotal levels and NAD+/NADH ratio in control and Fars2 knocked-down neurons at the indicated days of culture (mean ± SD; two-tailed unpaired t-Test, **P < 0.01; ***P < 0.001; ****P < 0.0001; n = 5–6). J Transmission electron micrograph of mitochondria in cortex from control and cKO mice embryos at the indicated embryonic ages. Scale bars: 0.5 μm for E 14.5 and E 17.5 samples and 5 μm for P 0.5 samples. K Percentage of mitochondria with abnormal cristae in CTRL and cKO cortex at indicated embryonic ages (mean ± SD; two-tailed unpaired t-Test, *P < 0.05; n = 3). L Transmission electron micrograph of mitochondria in control and Fars2 knocked-down neurons at the indicated days of culture. Linearized mitochondrial cristae and the geometrical shapes are indicated by red lines and asterisks. Scale bars: 0.5 μm. M Percentage of mitochondria with abnormal cristae in control and Fars2 knocked-down neurons at the indicated days of culture (mean ± SD; two-tailed unpaired t-Test, **P < 0.01; ***P < 0.001; n = 3) |