
FIGURE
Fig. 3
- ID
- ZDB-FIG-220706-86
- Publication
- Gabryelska et al., 2022 - Global mapping of RNA homodimers in living cells
- Other Figures
- All Figure Page
- Back to All Figure Page
Fig. 3
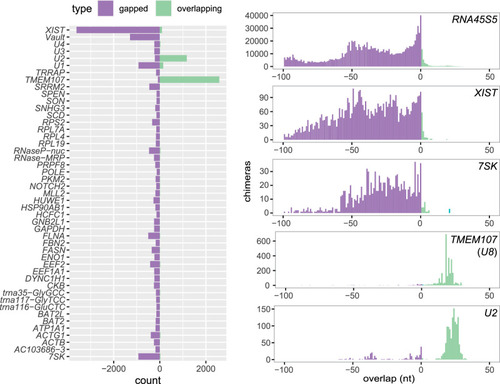
Distribution of overlap scores in individual genes in PARIS experiment. Counts of gapped and ungapped chimeras (purple) and overlapping chimeras (green) in individual genes in PARIS data from human HEK293 cells (Lu et al. 2016) (left), and distribution of the overlap value L in selected genes. |
Expression Data
Expression Detail
Antibody Labeling
Phenotype Data
Phenotype Detail
Acknowledgments
This image is the copyrighted work of the attributed author or publisher, and
ZFIN has permission only to display this image to its users.
Additional permissions should be obtained from the applicable author or publisher of the image.
Full text @ Genome Res.