|
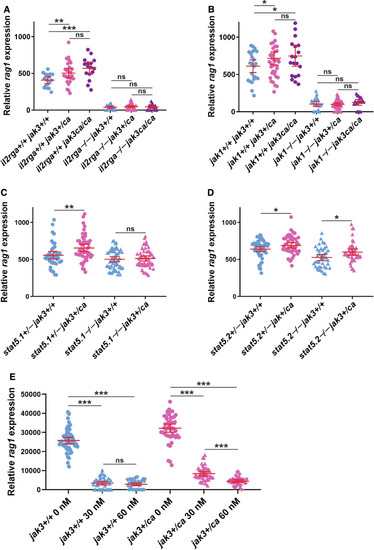
Molecular analysis of Jak3 A573V mutants. A-D. Genetic studies. Relative rag1 expression of jak3+/+, jak3+/ca and jak3ca/ca embryos on the indicated il2rga (A), jak1 (B), stat5.1 (C) and stat5.2 (D) genetic backgrounds, as detailed in Supp. Figure 1, 2, 3 and 4, respectively. Results for individual embryos of the relevant genotypes are shown along with mean and SEM in red and statistically significant differences indicated (*p < 0.05, **p < 0.01, ***p < 0.001, ns: not significant, n = 400). For simplicity, the results for some genotypes in panels A, B have been omitted. E Pharmacological studies. Relative rag1 expression of jak3+/+, jak3+/ca and jak3ca/ca embryos in the presence of the indicated Tofacitib concentrations. Results for individual embryos are shown along with mean and SEM in red and statistically significant differences indicated (***p < 0.001, ns: not significant, n = 400)
|