
Fig. 2
- ID
- ZDB-FIG-220620-13
- Publication
- Yao et al., 2022 - Comparing the folding landscapes of evolutionarily divergent procaspase-3
- Other Figures
- All Figure Page
- Back to All Figure Page
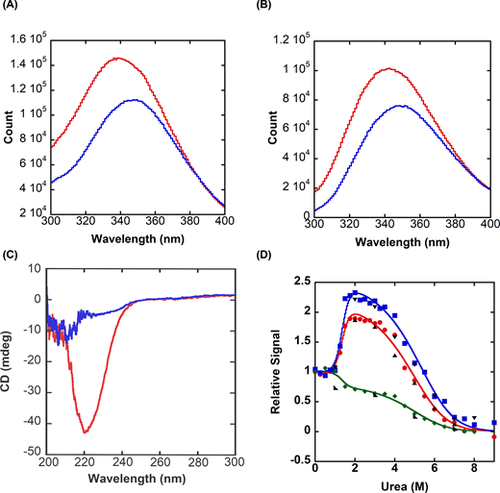
Spectroscopic properties of zebrafish procaspase-3b (CP-C117S) (A) Fluorescence emission scan of DrPCP3b following excitation at 280 nm in buffer containing zero urea (red) or 8 M urea (blue). (B) Fluorescence emission scan of DrPCP3b following excitation at 295 nm in buffer containing zero urea (red) or 8 M urea (blue). (C) Circular dichroism (CD) far-UV scan of DrPCP3b in buffer containing zero urea (red) or 8 M urea (blue). (D) Representative equilibrium unfolding/folding of DrPCP3b at pH 7 by fluorescence emission (average emission wavelength) following excitation at 280 nm ( |
 ), 295 nm (
 ), and CD at 224 nm (
 ). Refolding data for fluorescence emission (280 nm (▲) and 295 nm (▼)) and CD (◣) show that folding is reversible. Solid lines represent global fits to a three-state folding model, as described in the text.