
Fig. 4
- ID
- ZDB-FIG-220609-4
- Publication
- Zhang et al., 2021 - Rapid generation of maternal mutants via oocyte transgenic expression of CRISPR-Cas9 and sgRNAs in zebrafish
- Other Figures
- All Figure Page
- Back to All Figure Page
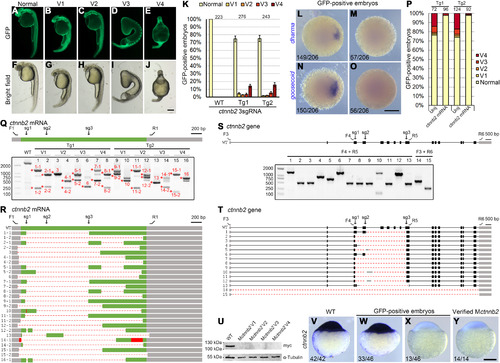
(A to J) Phenotypes of GFP-positive embryos simultaneously expressing three ctnnb2 sgRNAs. (K) Statistical analysis of ventralized phenotypes in GFP-positive offspring from two mutation-carrying F0 fish. Numbers designate total embryos analyzed. Error bars indicate SDs from three independent spawnings. (L to O) Absence of dharma and goosecoid expression in GFP-positive Mctnnb2 embryos. (P) The ventralized phenotype in GFP-positive embryos can be rescued by overexpressing the wild-type ctnnb2-myc mRNA. Numbers on top represent total embryos scored. Tg1 and Tg2 are two independent mutation-carrying F0 fish. (Q) RT-PCR analysis of the CDS from 16 Mctnnb2 mutant embryos. Wild-type embryos served as a control. Deletion alleles were present in all mutant embryos. V1 to V4 indicate degrees of ventralized phenotypes, as shown in (A) to (J). Asterisks and numbers designate PCR products subjected to Sanger sequencing. F1 and R1 are primers to amplify the CDS of ctnnb2 transcripts. The positions of the three sgRNA sites are indicated as sg1 to sg3. Grey boxes indicate UTRs, the green box represents the CDS region, dashed lines represent deletions, and red boxes indicate insertions. (R) Sequencing results of PCR products show extensive deletion events. (S) Analysis of deletion events in the genome of Mctnnb2 mutant embryos using indicated primers. Gray boxes indicate UTRs, and black boxes represent coding regions. Primer positions and sgRNA targeting sites are indicated on the wild-type allele. (T) Sequencing results show different deletion patterns at the ctnnb2 locus. (U) No Ctnnb2 protein product was produced after injecting expression libraries from Mctnnb2 embryos with V1-V4 phenotypes. (V to Y) ISH was used to examine the absence of ctnnb2 transcripts in Mctnnb2 mutants among GFP-positive embryos at the sphere stage. Scale bars, 250 μm. |