
- Title
-
Rapid generation of maternal mutants via oocyte transgenic expression of CRISPR-Cas9 and sgRNAs in zebrafish
- Authors
- Zhang, C., Lu, T., Zhang, Y., Li, J., Tarique, I., Wen, F., Chen, A., Wang, J., Zhang, Z., Zhang, Y., Shi, D.L., Shao, M.
- Source
- Full text @ Sci Adv
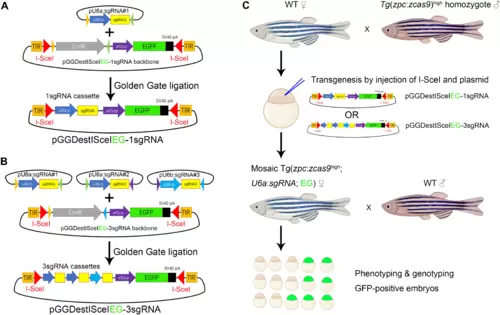
(A) Construction of pGGDestISceIEG-1sgRNA plasmid that contains a single sgRNA expression cassette and a GFP expression module driven by the ef1α promoter. I-SceI restriction sites and TIR are designed to flank sgRNA and GFP sequences for transgenesis. EGFP, enhanced GFP. (B) Construction of the transgenic pGGDestISceIEG-3sgRNA vector expressing three tandem sgRNAs via Golden Gate ligation. (C) Pipeline to generate maternal mutants in F1 embryos. The sgRNA expression cassette is introduced into Tg(zpc:zcas9) embryos by I-SceI–mediated transgenesis, and the phenotype of the resulting GFP-positive F1 embryos is examined to identify developmental defects. CmR represents the chloramphenicol resistant gene, while EG highlighted in green designates the GFP expression cassette driven by the ef1α promoter. WT, wild type. |
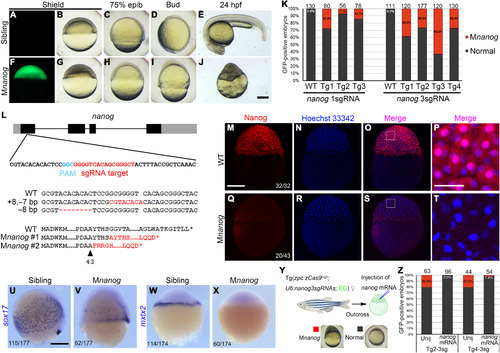
(A to E) GFP-negative F1 sibling embryos developed normally. (F to J) Typical Mnanog defective phenotypes observed among GFP-positive embryos. All embryos are lateral view with the dorsal region on the right (A to D and F to I) or upward (E and J). (K) Stacked columns show the ratio of Mnanog-like defective embryos among GFP-positive offspring in Tg(zpc:zcas9) background. Higher efficiency in generating maternal mutants was observed by expressing three sgRNAs. Numbers on the top of each column represent the total GFP-positive embryos scored. WT, wild-type fish; Tg1 to Tg4, different mutation-carrying F0 founders. (L) Single sgRNA expression in Tg(zpc:zcas9) leads to indel in nanog maternal transcripts, resulting in frameshift and premature termination of translation. The four exons of nanog are represented by black boxes, with gray indicating untranslated regions (UTRs). Mutant transcripts were identified in two independent embryos at 3 hpf. The dashed line corresponds to deleted nucleotides; red bases indicate insertions. Red letters in protein sequences indicates amino acid residues translated after frameshift mutation. The arrowhead represents the position of amino acid in wild-type protein. (M to P) Nuclear accumulation of Nanog protein in 3-hpf wild-type embryos revealed by immunofluorescence. (Q to T) Absence of Nanog protein expression in 3-hpf Mnanog embryos. (P and T) Magnified images of framed regions in (O) and (S). Hoechst 33342 (blue) was used to stain nuclei. (U to X) In situ hybridization (ISH) analysis shows the expression of sox17 at 7.5 hpf and mxtx2 at the sphere stage. (Y) Procedure to rescue Mnanog phenotype by mRNA injection. (Z) Stacked columns show a nearly complete rescue of Mnanog mutant defects after injection of the wild-type nanog-myc mRNA. Unij, Uninjected. Numbers represent total embryos scored from two experiments. Scale bars, 50 μm (P and T) and 250 μm (others). |
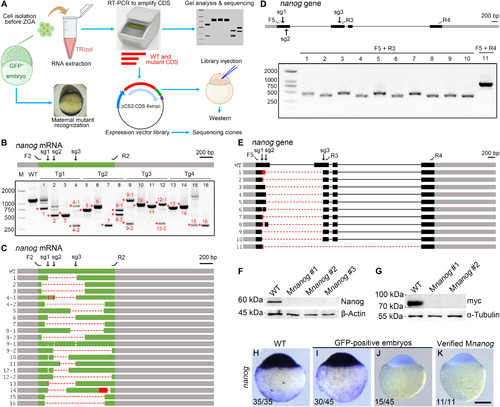
(A) Strategy combining phenotyping and genotyping. Cells are isolated from GFP-positive embryos at 3 hpf and stored in TRIzol. When donors developed maternal mutant phenotype, total RNAs from isolated cells are extracted and analyzed by RT-PCR. Primers are designed to amplify the entire wild-type CDS. PCR products are either analyzed by gel electrophoresis or subcloned into pCS2-MT vector, generating a mini expression library. A control library is made from a wild-type embryo using the same set of primers. These primers ensure the in-frame ligation of the wild-type CDS and the myc epitopes. The libraries are either injected to express protein or subjected to sequencing. (B) RT-PCR analysis of nanog CDS region from 16 Mnanog embryos shows the presence of truncated transcripts. Red asterisks and numbers indicate PCR products subjected to Sanger sequencing. F2 and R2 represent primers to amplify the CDS region. The positions of sgRNA targeting sites are marked as sg1 to sg3. Gray boxes indicate UTRs, and the green represents the CDS region. (C) Diagram summarizes the sequencing results. Dashed lines and red boxes represent deletions and insertions, respectively. (D) Analysis of genomic deletions in Mnanog mutants using different primer sets as displayed on the nanog gene. Grey and black boxes designate UTR and CDS regions of exons, respectively; thin lines indicate introns. (E) Sequencing of PCR products reveals various patterns of genomic deletions. (F) Absence of Nanog protein in verified Mnanog embryos at 3 hpf. (G) Injection of expression libraries constructed from two Mnanog mutants produced no myc-tagged protein product. (H to K) ISH was used to examine the absence of nanog transcripts in Mnanog mutants among GFP-positive embryos at the sphere stage. Scale bar, 250 μm. |
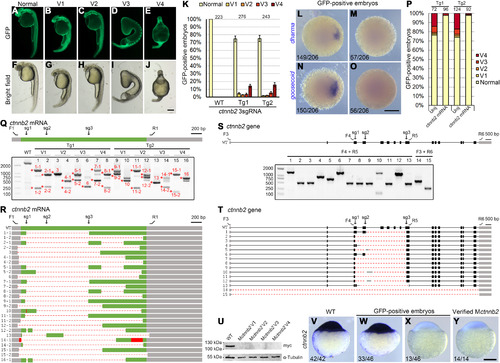
(A to J) Phenotypes of GFP-positive embryos simultaneously expressing three ctnnb2 sgRNAs. (K) Statistical analysis of ventralized phenotypes in GFP-positive offspring from two mutation-carrying F0 fish. Numbers designate total embryos analyzed. Error bars indicate SDs from three independent spawnings. (L to O) Absence of dharma and goosecoid expression in GFP-positive Mctnnb2 embryos. (P) The ventralized phenotype in GFP-positive embryos can be rescued by overexpressing the wild-type ctnnb2-myc mRNA. Numbers on top represent total embryos scored. Tg1 and Tg2 are two independent mutation-carrying F0 fish. (Q) RT-PCR analysis of the CDS from 16 Mctnnb2 mutant embryos. Wild-type embryos served as a control. Deletion alleles were present in all mutant embryos. V1 to V4 indicate degrees of ventralized phenotypes, as shown in (A) to (J). Asterisks and numbers designate PCR products subjected to Sanger sequencing. F1 and R1 are primers to amplify the CDS of ctnnb2 transcripts. The positions of the three sgRNA sites are indicated as sg1 to sg3. Grey boxes indicate UTRs, the green box represents the CDS region, dashed lines represent deletions, and red boxes indicate insertions. (R) Sequencing results of PCR products show extensive deletion events. (S) Analysis of deletion events in the genome of Mctnnb2 mutant embryos using indicated primers. Gray boxes indicate UTRs, and black boxes represent coding regions. Primer positions and sgRNA targeting sites are indicated on the wild-type allele. (T) Sequencing results show different deletion patterns at the ctnnb2 locus. (U) No Ctnnb2 protein product was produced after injecting expression libraries from Mctnnb2 embryos with V1-V4 phenotypes. (V to Y) ISH was used to examine the absence of ctnnb2 transcripts in Mctnnb2 mutants among GFP-positive embryos at the sphere stage. Scale bars, 250 μm. |
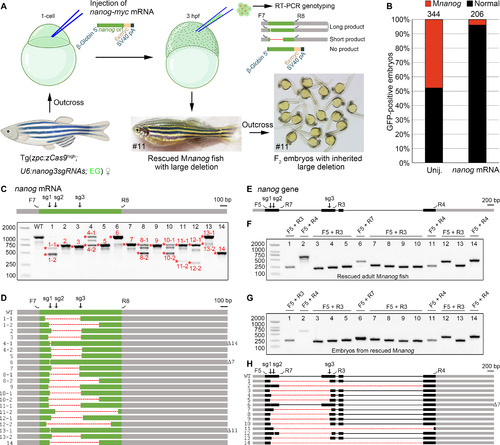
(A) Diagram demonstrates the rescue of Mnanog lethal phenotype by injection of wild-type nanog-myc mRNA, identification of rescued maternal mutants, and the resulted deletion-containing F1 fish and F2 embryos. A pair of primers was designed to specifically amplify the CDS of endogenous nanog mRNA. The rescued F1 adult female fish shown in the diagram carries an inherited unintended large deletion in one allele. Thus, F2 offspring derived from outcross with a wild-type fish developed normally. (B) Stacked bars show the efficient rescue of Mnanog lethal phenotype by injecting 150 pg per embryo nanog-myc mRNA. (C) RT-PCR analysis of nanog coding region in 14 rescued Mnanog embryos. Asterisks and numbers designate bands subjected to Sanger sequencing. In the schema of nanog mRNA, gray boxes indicate UTRs, and the green box represents the CDS region. F7 and R8 represent the primer pair used for amplification of nanog ORF. The three sgRNA target sites are marked by sg1, sg2, and sg3. (D) Sequencing results of PCR products as indicated in (C). Dashed lines represent deletions. Numbers of deleted nucleotides in small indels are indicated on the right. (E) Schema of nanog gene with sgRNA target sites and genotyping primers indicated. Gray boxes indicate UTRs, and black boxes represent coding regions. (F) PCR analysis of deletions in 14 rescued Mnanog mutant adults. Primer pairs are indicated on the top of each lane and their positions can be found in (E). (G) Similar patterns of genomic deletions in offspring derived from outcrosses of 14 rescued F1 Mnanog mutant adult fish with wild-type fish. (H) Sequence analyses of PCR products from 14 rescued F1 Mnanog adults. Their outcrossed offspring displayed identical deletions in the genome. Photo credit: Chong Zhang, Shandong University. |