
Fig. 1
- ID
- ZDB-FIG-220526-38
- Publication
- Liu et al., 2022 - Spatiotemporal mapping of gene expression landscapes and developmental trajectories during zebrafish embryogenesis
- Other Figures
- All Figure Page
- Back to All Figure Page
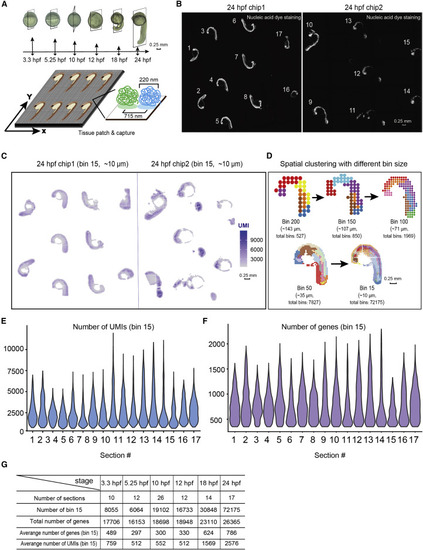
Figure 1. The Stereo-seq on multiple sections of the developing zebrafish embryos (A) Experimental outline (top): diagram of the zebrafish embryos and sagittal cryosections at different development stages which were subjected to Stereo-seq. Scale bars, 0.25 mm. Stereo-seq process diagram (bottom): the enlarged image shows the size of each spot and the distance between 2 adjacent spots. (B) Nucleic-acid dye staining of the 24-hpf zebrafish embryo sections attached on two 1-cm2 Stereo-seq chips. The number represents the serial number given to each section. Scale bars, 0.25 mm. (C) Spatial visualization of the distribution of captured transcripts (unique molecular identifiers [UMIs]) on all 24-hpf zebrafish embryo sections. Scale bars, 0.25 mm. (D) Unsupervised clustering of the 24-hpf zebrafish embryo section based on Stereo-seq data at different bin sizes. Scale bars, 0.25 mm. (E and F) Violin plot of the number of captured transcripts (E) and genes (F) of each 24-hpf zebrafish embryo section. (G) Table summarizing the numbers of sections used, total numbers of genes, total number of bins at bin-15 resolution, average captured number of UMIs, and genes at bin-15 resolution for each developmental stage in Stereo-seq. |
Reprinted from Developmental Cell, 57(10), Liu, C., Li, R., Li, Y., Lin, X., Zhao, K., Liu, Q., Wang, S., Yang, X., Shi, X., Ma, Y., Pei, C., Wang, H., Bao, W., Hui, J., Yang, T., Xu, Z., Lai, T., Berberoglu, M.A., Sahu, S.K., Esteban, M.A., Ma, K., Fan, G., Li, Y., Liu, S., Chen, A., Xu, X., Dong, Z., Liu, L., Spatiotemporal mapping of gene expression landscapes and developmental trajectories during zebrafish embryogenesis, 1284-1298.e5, Copyright (2022) with permission from Elsevier. Full text @ Dev. Cell