|
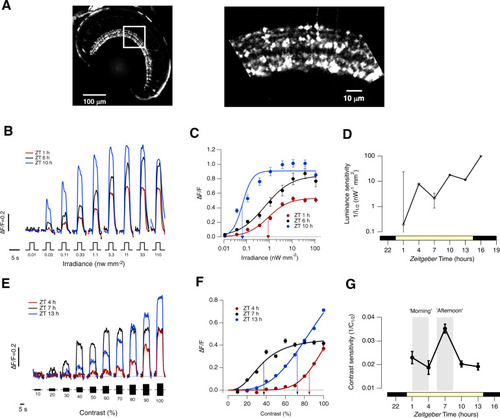
Differential regulation of luminance sensitivity and contrast sensitivity.A Left: Retina of a Ribeye:SyGCaMP2 fish with box over the inner plexiform layer (IPL). Right: expansion of the boxed region showing terminals of bipolar cells. Zebrafish larvae were 7–9 days post-fertilization. B Averaged responses from ON terminals to light steps of different irradiance measured at Zeitgeber time 1, 6 and 10 hours. Note large variations in amplitude and kinetics. The full-field light stimuli were generated by an amber LED (lmax = 590 nm) which will most effectively stimulate red and green cones. Each light step lasted 3 s (n = 535 terminals from 10 fish). C Peak response as a function of irradiance for ON terminals in (B). The smooth lines are Hill functions of the form R = Rmax*(Ih/(Ih + I1/2h)), where R is the peak response, I is the irradiance, h is the Hill coefficient and I1/2 is the irradiance generating the half-maximal response. At ZT = 6 h: Rmax = 0.91 ± 0.04; h = 2.0 ± 0.2; I1/2 = 0.066 ± 0.02 nW/mm2 (dashed blue arrow). At ZT = 10 h: Rmax = 0.85 ± 0.06; h = 0.8 ± 0.1; I1/2 = 0.65 ± 0.18 nW/mm2. At ZT = 1 h: Rmax = 0.853 ± 0.02; h = 0.9 ± 0.2; I1/2 = 0.88 ± 0.18 nW/mm2 (dashed red arrow). D Variations in luminance sensitivity as a function of Zeitgeber time averaged across both ON and OFF terminals (n = 535 and 335 terminals, respectively). The lower bar shows the timing of the light-dark cycle. Error bars are ± 1 SD. E Averaged responses to stimuli of different contrasts (i.e. sinusoidal modulations in light intensity around a mean) measured at Zeitgeber time 4, 7 and 13 h averaged across both ON and OFF terminals (n = 949 from 21 fish). F Peak response amplitude as a function of contrast for terminals shown in E. The smooth lines are Hill functions used to interpolate values of C1/2, the contrast generating the half-maximal response. Note the diurnal variations. At ZT = 4 h: C1/2 = 86 ± 2% (dashed red arrow); h = 7.0 ± 1.2. At ZT = 7 h: C1/2 = 35 ± 2% (dashed black arrow); h = 2.7 ± 0.2. At ZT = 13 h: C1/2 = 72 ± 2%; h = 3.3 ± 0.2 (dashed blue arrow). G Variations in contrast sensitivity as a function of Zeitgeber time averaged across ON and OFF terminals (n = 949 from 21 fish). Note the peak around ZT = 7 h which is not mirrored in the diurnal variation in luminance sensitivity (D). The grey bars show the periods described as “morning” and “afternoon”. All error bars show ± 1 s.e.m. except for (D) which is ± 1 SD. Source data are provided as a Source Data file.
|