
Figure 3
- ID
- ZDB-FIG-220514-3
- Publication
- Thomson et al., 2021 - The zebrafish presomitic mesoderm elongates through compaction-extension
- Other Figures
- All Figure Page
- Back to All Figure Page
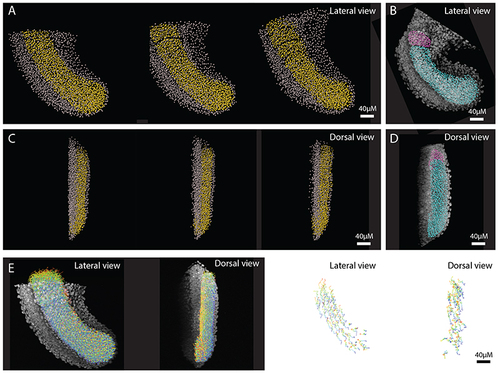
Tracks were generated of the whole tailbud and all non-paraxial mesoderm tracks were then manually removed. Paraxial mesoderm (PM) tracks (yellow spots) and non-paraxial mesoderm tracks (grey spots) shown at 0, 1, and 2 hours after imaging. (B) PM spots reconstructions (cyan: PSM & pink: nascent somite) from a similar-stage HCR image is shown for comparison/validation of selection accuracy. (C, D) The same images as above, but from a dorsal view: anterior is top, medial is left. (E) All PM tracks of full movie (colour-coded by time) superimposed over first frame image, shown for lateral and dorsal views (left images), and a sub-set of tracks shown in isolation, for lateral and dorsal views (right images). |