
FIGURE
Figure 7
- ID
- ZDB-FIG-220430-164
- Publication
- Džulová et al., 2022 - Incomplete Recovery of Zebrafish Retina Following Cryoinjury
- Other Figures
- All Figure Page
- Back to All Figure Page
Figure 7
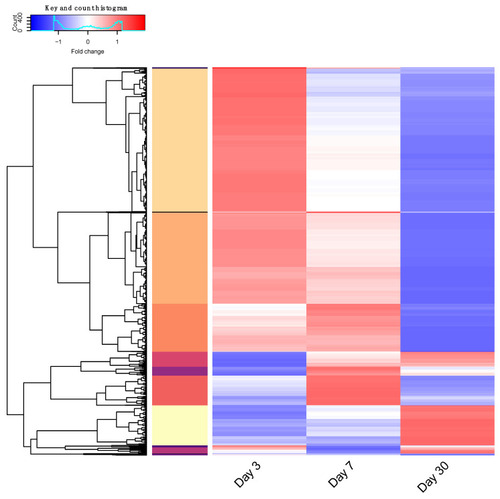
RNAseq analysis gene clustering. Genes showing differential expression over three time points scaled per-gene. Hierarchical clustering was performed, and thirteen distinct groups determined by tree height are illustrated by color in the left vertical bar. Fold change in gene expression is represented by color over days 3, 7, and 30; low—blue to high—red. Scaled expression data are listed in |
Expression Data
Expression Detail
Antibody Labeling
Phenotype Data
Phenotype Detail
Acknowledgments
This image is the copyrighted work of the attributed author or publisher, and
ZFIN has permission only to display this image to its users.
Additional permissions should be obtained from the applicable author or publisher of the image.
Full text @ Cells