
Figure 1
- ID
- ZDB-FIG-220416-67
- Publication
- Tonon et al., 2022 - 5-Azacytidine Downregulates the Proliferation and Migration of Hepatocellular Carcinoma Cells In Vitro and In Vivo by Targeting miR-139-5p/ROCK2 Pathway
- Other Figures
- All Figure Page
- Back to All Figure Page
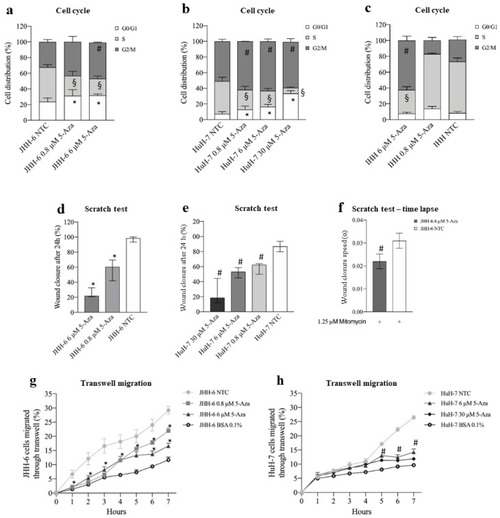
Figure 1. Effects of 5-Aza on cell growth and migration. (a–c) Cell cycle phase distribution. Data, expressed as mean ± SEM, are reported as percentage. JHH-6 NTC G0/G1 vs. JHH-6 0.8/6 μM 5-Aza G0/G1, * p < 0.021; JHH-6 NTC S vs. JHH-6 0.8/6 μM S, § p < 0.0087; JHH-6 NTC G2/M vs. JHH-6 0.8/6 μM G2/M, # p < 0.011, n = 5. HuH-7 NTC G0/G1 vs. HuH-7 0.8/6/30 5-Aza μM G0/G1, * p < 0.022; HuH-7 NTC S vs. HuH-7 0.8/6/30 5-Aza μM S, § p < 0.024; HuH-7 NTC G2/M vs. HuH-7 0.8/6/30 μM G2/M, # p < 0.045, n = 3. IHH NTC S vs. IHH 6 μM 5-Aza S, § p < 0.0003; IHH NTC G2/M vs. IHH 6 μM 5-Aza G2/M, # p = 0.0012, n = 3. (d,e) Cell migration, evaluated by scratch assay. Data, expressed as percentage, are presented as median with interquartile range; JHH-6/NTC vs. JHH-6 0.8/6 5-Aza μM, * p = 0.0012, n = 6; HuH-7/NTC vs. HuH-7 0.8/6/30 5-Aza μM, # p = 0.0002, n = 8. (f) Wound healing experiments were analyzed by measuring the reduction in the area of the cell-free region over time (A), normalized with respect to its initial value (A0); the slope of the linear range of the A/A0 vs. t curve can be considered a measure of the wound closure velocity α (h−1); JHH-6/NTC/mitomycin vs. JHH-6/6 μM 5-Aza/mitomycin, # p = 0.012, n = 5. (g,h) Effects on cell migration, evaluated by FATIMA assay. Data, expressed as mean ± SEM, are reported as percentage. JHH-6/NTC vs. JHH-6 0.8/6 5-Aza μM, * p < 0.046, n = 5; HuH-7/NTC vs. HuH-7 6/30 5-Aza μM, # p < 0.014, n = 4; BSA: bovine serum albumin (control-treated cells). |