
Figure 9
- ID
- ZDB-FIG-220416-54
- Publication
- Tonon et al., 2022 - 5-Azacytidine Downregulates the Proliferation and Migration of Hepatocellular Carcinoma Cells In Vitro and In Vivo by Targeting miR-139-5p/ROCK2 Pathway
- Other Figures
- All Figure Page
- Back to All Figure Page
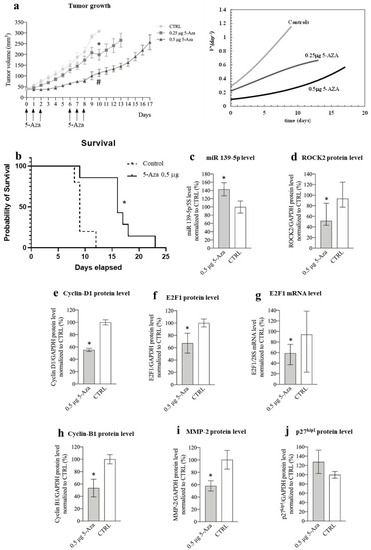
Figure 9. Phenotypic and molecular effects of 5-Aza in the xenograft mouse model of HCC. (a) Effects of 5-Aza on tumor growth. Left: the arrows indicate the administration times for 5-Aza (either 0.25 μg or 0.5 μg per injection); data are reported in mm3 as mean ± SEM, 0.5 μg 5-Aza/day1-10 vs. CTRL (saline solution treated animals) days 1-10, # p = 0.0022; 0,25μg 5-Aza/day1-10 vs. CTRL day/1-10, * p = 0.0036. Right: Equation (3) best fit to tumor growth data determines the dimensionless tumor speed velocity VD+ (Equation (4)) expressing the number of cells generated by each original cell after time. (b) Kaplan–Meier curve; mice were treated either with 0.5 μg 5-Aza/day or with saline solution (CTRL), log-rank (Mantel–Cox) test, * p = 0.03, n = 6. (c) miR-139-5p expression level; data normalized to 5s rRNA content and to the average of CTRL are reported in % as mean ± SEM, CTRL vs. 0.5 μg 5-Aza, * p= 0.047, n = 6. (d) Effects of 5-Aza on ROCK2 protein level; data normalized to GAPDH levels and to the average of CTRL are reported in % as median with interquartile range, n = 6; CTRL vs. 0.5 μg 5-Aza, * p = 0.041, n = 6. (e) Effects of 5-Aza on cyclin D1 protein level; data normalized to GAPDH levels and to the average of CTRL are reported in % as mean ± SEM, n = 6; CTRL vs. 0.5 μg 5-Aza, * p = 0.0001. (f) Effects of 5-Aza on E2F1 protein level; data normalized to GAPDH levels and to the average of CTRL are reported in % as mean ± SEM, n = 6; CTRL vs. 0.5 μg 5-Aza, * p = 0.047. (g) Effects of 5-Aza on E2F1 mRNA level; data normalized to 28S levels and to the average of CTRL are reported in % as median with interquartile range, CTRL vs. 0.5 μg 5-Aza, * p = 0.041, n = 6. (h) Effects of 5-Aza on cyclin B1 protein level; data normalized to GAPDH levels and to the average of CTRL are reported in % as mean ± SEM, n = 5; CTRL vs. 0.5 μg 5-Aza, * p = 0.002. (i) Effects of 5-Aza on MMP-2 protein level; data normalized to GAPDH levels and to the average of CTRL are reported in % as mean ± SEM, n = 6; CTRL vs. 0.5 μg 5-Aza, * p = 0.045. (j) Effects of 5-Aza on p27kip protein level; data normalized to GAPDH levels and to the average of CTRL are reported in % as mean ± SEM, n = 5. |