
FIGURE
Figure 5—figure supplement 1.
- ID
- ZDB-FIG-220416-100
- Publication
- Yang et al., 2022 - Innervation modulates the functional connectivity between pancreatic endocrine cells
- Other Figures
- All Figure Page
- Back to All Figure Page
Figure 5—figure supplement 1.
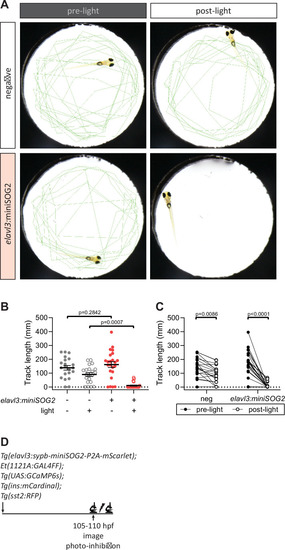
(A) Swimming activity of Tg(elavl3:sypb-miniSOG2-P2A-mScarlet) zebrafish at 110 hpf was tracked pre- and post-blue light exposure for 5 min. Green lines show tracks at the end of the time-lapse. (B, C) Quantification of swimming activity of Tg(elavl3:sypb-miniSOG2-P2A-mScarlet) zebrafish at 110 hpf; mean ± standard error of the mean (SEM), n = 21–23 animals, p values from two-way analysis of variance (ANOVA) with Holm–Sidak’s multiple comparisons test. (D) Schematic of optogenetic neural inhibition experiment. |
Expression Data
Expression Detail
Antibody Labeling
Phenotype Data
Phenotype Detail
Acknowledgments
This image is the copyrighted work of the attributed author or publisher, and
ZFIN has permission only to display this image to its users.
Additional permissions should be obtained from the applicable author or publisher of the image.
Full text @ Elife