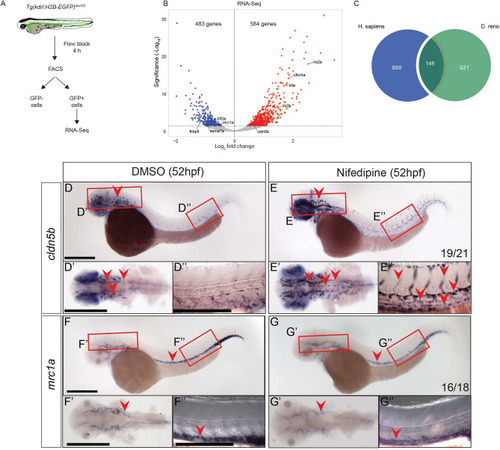
Blocking blood flow in zebrafish reveals genes regulated by shear stress in developing embryos. (A) Schematic representation of EC FACS sorting from Tg(kdrl:H2B-EGFP)mu122 embryos treated with nifedipine for 4 h at 48 hpf to induce flow block. Sorted GFP + cells were used for RNA-Seq. As control, embryos were treated with a corresponding amount of DMSO. (B) Volcano plot showing gene expression changes in ECs after flow block in zebrafish embryos. Differentially expressed (DE) genes (FDR < 0.05) are labelled in red (upregulated) and blue (downregulated after flow block). (C) Overlap of flow-regulated genes in human and zebrafish datasets. All DE genes were used for this analysis. (D,E) Whole mount in situ hybridization for cldn5b in 52 hpf embryos after 4 h of treatment with DMSO (D) or nifedipine (E). Regions in the head and the trunk highlighted with red boxes in (D,E) are magnified in (D′,E′,D′′,E′′), respectively. Vascular expression is highlighted with red arrowheads. (F,G) Whole mount in situ hybridization for mrc1a after flow block from 48 to 52 hpf. Regions in the head and the trunk highlighted with red boxes in (F,G) are magnified in (F′,G′,F′′,G′′), respectively. Vascular expression is highlighted with red arrowheads. Numbers represent the number of embryos with the depicted expression pattern out of the total number of embryos analyzed. Scale bar is 300 μm.
|
